Remove Course Remove Data Remove Demo Remove How To
article thumbnail

Near-real-time data-driven route optimization best practices

FreightWaves SONAR

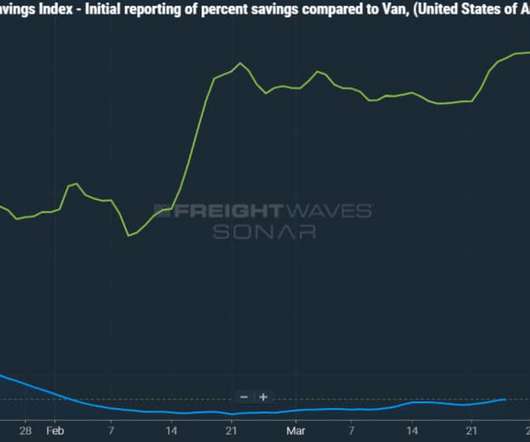
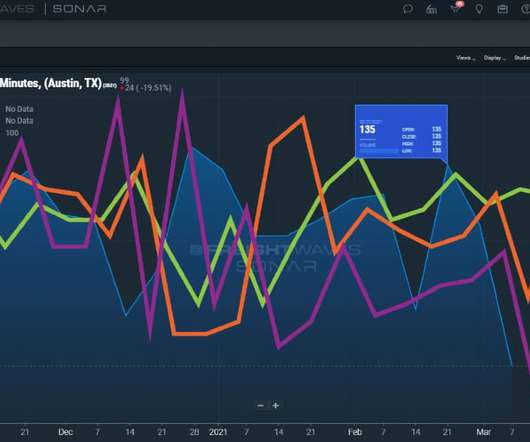
Data represents an integral part of daily life for most people, and it is no different within the transportation industry. That insight into how freight logistics and optimization rely on data and understanding the full picture is critical to making the best improvements in supply chain route optimization too.

article thumbnail

What Are Reorder Points and How to Calculate Them

Ship Monk

This article will explain what reorder points are and show you how to calculate them. How to Calculate a Reorder Point. How to Calculate Demand During Lead Time. Average lead time is 30 days, including manufacturing and shipping, and over the course of a year you sell an average of 29 units per day. Improving Data.

How To 52
Insiders

Sign Up for our Newsletter

This site is protected by reCAPTCHA and the Google Privacy Policy and Terms of Service apply.

Trending Sources

article thumbnail

Manufacturing Supply Chain Constraints and How to Overcome Them

FreightWaves SONAR

So, it’s equally valuable to know the constraints and to apply data to overcome them with mini-bids. Request a SONAR SCI Lane Acuity demo to get started or click the button below. Request a SONAR Demo. Request a SONAR SCI Demo. It is what sets manufacturing supply chain companies apart.

article thumbnail

How to Calculate Safety Stock: Three Different Calculations

EazyStock

In reality, of course, this rarely happens. Using this information and her sales data from last month, she can work out safety stock for each showerhead SKU: Shower head A: (630 x 1.5) – (582.50 However, just like using the fixed safety stock method, time-based calculations can also often lead to over- and under-stocking. x 1) = 362.50

How To 52
article thumbnail

[WHITE PAPER] Mo’ inflation, mo’ problems for CPG companies

FreightWaves SONAR

Therefore, in the absence of hedging, CPG companies should utilize as much freight-related data as possible to mitigate freight costs more effectively and improve supply chain efficiency. Illustrations of how to do that are found in the following pages. Request a SONAR Demo. Request a SONAR SCI Demo.

article thumbnail

Resources to help deepen your understanding of the freight market

FreightWaves SONAR

High-frequency data It is a widely accepted truth that data plays an important role in revealing the state of the freight market. Until only a few years ago, using data to make informed decisions in the transportation space had meant extrapolating historical insights to predict probable future conditions. port activity.

article thumbnail

10 Challenges for Shippers in Negotiating Trucking Contracts

FreightWaves SONAR

Using real-time data , freight managers can finally begin to recognize their opportunities for better business relationships. And it’s equally important to know the top 10 challenges for shippers in negotiating trucking contracts like limited headhaul insight and how to overcome them. Rate data is subject to market conditions.