Remove Blog Remove Demo Remove Industry Remove Outbound
article thumbnail

Using SONAR to Understand Local Markets and Seasonality

FreightWaves SONAR

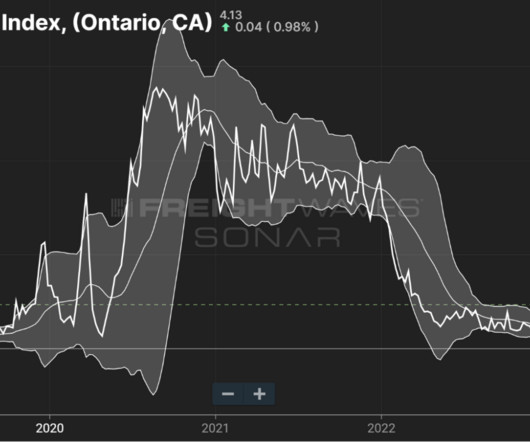
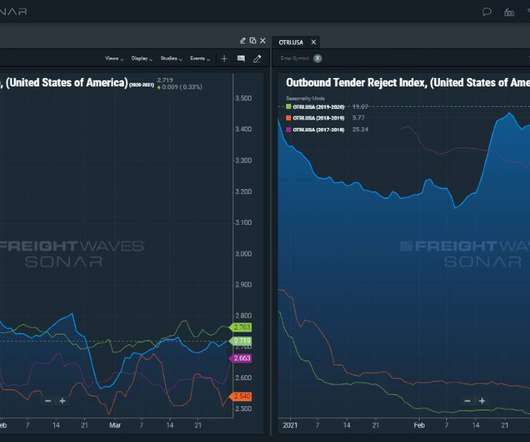
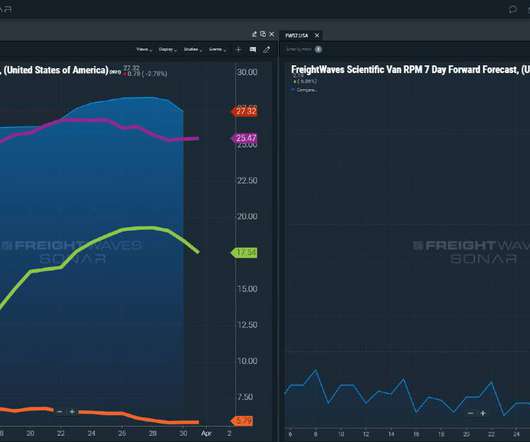
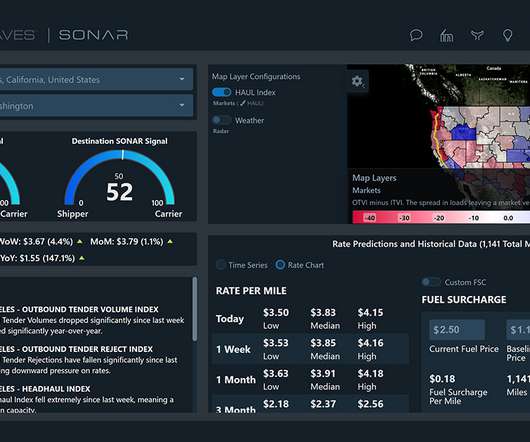
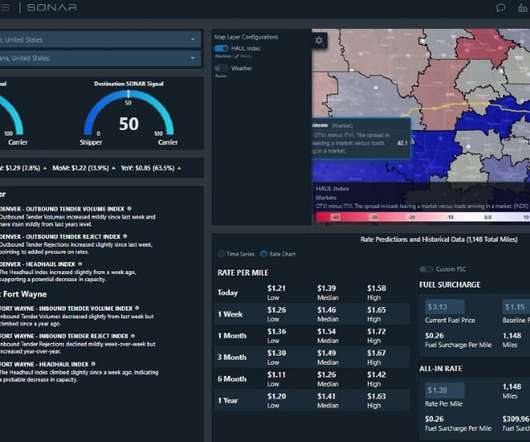
While very few industry players need to worry about all of these markets all the time, taking stock of the national-level information from your own dashboards alongside key market areas (KMAs) can fully empower decision making in an ever-changing market. Take one of the biggest markets in the land: Ontario, California.

article thumbnail

2021 Truck industry disruption factors: how to continue with operational excellence and profitability (part 2)

FreightWaves SONAR

Yet, truck industry analyses and insight into existing conditions can help safeguard against uncertainty. Therefore, the pressures placed on last mile delivery may have a compounding effect, forcing truck industry participants to grapple with inefficiencies and grow more strategic. Request a SONAR Demo.

Insiders

Sign Up for our Newsletter

This site is protected by reCAPTCHA and the Google Privacy Policy and Terms of Service apply.

Trending Sources

article thumbnail

Identifying freight market trends across all modes

FreightWaves SONAR

Current market conditions are among the most difficult that the industry has faced in recent years. Request a SONAR Demo. Request a SONAR SCI Demo. Understanding freight trends from the beginning of the supply chain all the way through to delivery is important for all parties involved.

Trends 94
article thumbnail

The four factors that impact freight trucking revenue and profitability

FreightWaves SONAR

Leading metrics for tracking overall and market-specific activity include: Inbound and outbound load daily change rates, like the Outbound Tender Volume Index (OTVI) in FreightWaves SONAR. Freight market share over the last week, such as SONAR’s Outbound Tender Market Share (OTMS). Request a SONAR Demo.

article thumbnail

Why data is critical to freight routing guide compliance

FreightWaves SONAR

The guides outline the goals and the specific needs of individual carriers, load types, destinations and industry niches. Both inbound and outbound goods and shipments benefit from the inclusion of data and analytics , real-time tracking, automated processes, and modern technology. Request a SONAR Demo. Request a SONAR SCI Demo.

article thumbnail

What data is available to track intermodal freight shipping rates

FreightWaves SONAR

Today’s shipping and transportation industry has changed in several ways, even over just the last few years. Identifying current inbound and outbound rail volume rates in the current market. Predicted inbound and outbound fuel and maintenance budgeting needs. Request a SONAR Demo. Download the White Paper.

article thumbnail

SONAR Indices & Insights: See changes in capacity and a sense of shipping rates with the Weighted rejection index (WRI)

FreightWaves SONAR

The WRI combines outbound tender market share (OTMS) and the weekly change in tender rejection rates (OTRIW). For example Atlanta’s OTMS value is 4% and outbound rejections increased from 3% to 5% over the past seven days. Various market participants in the freight industry can rely on the WRI heatmaps in different use cases.