Remove Analysis Remove Blog Remove Examples Remove Outbound
article thumbnail

SONAR Indices & Insights: Plan and Measure Refrigerated Shipping Capacity & Rates

FreightWaves SONAR

In this article, you learn what are the various reefer freight data indices available in SONAR, who in the freight market relies on these indices, what the indices tell freight market participants, and real-world scenario analysis of using SONAR refrigerated shipping indices to better understand the freight market.

article thumbnail

What Is Transportation Optimization and What Does It Have to Do With Managed Transportation

GlobalTranz

Managed transportation is about streamlining and centralizing the whole process of both inbound and outbound logistics, ranging from warehousing through delivery. Using an offshore vendor to manufacture a component for a larger automotive assembly is a typical example.

Insiders

Sign Up for our Newsletter

This site is protected by reCAPTCHA and the Google Privacy Policy and Terms of Service apply.

Trending Sources

article thumbnail

FreightWaves SONAR releases Capacity Trend Indices

FreightWaves SONAR

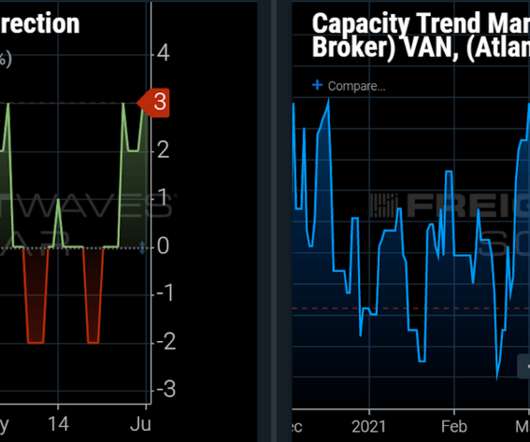
Measuring capacity is a key to maximizing margins/transactions for a broker, utilization for a carrier, and minimizing service and budgetary failures for shippers.The capacity trend indices show you which markets are tightening or loosening by the largest amounts by combining tender rejection rates and market balance of inbound and outbound loads.

Trends 52
article thumbnail

KPIs to assist manufacturers and distributors with supply chain challenges

SYSPRO Smarter ERP

Another methodology is the Porter’s Value Chain Framework, which comprises of inbound logistics, operations, outbound logistics, sales, and service. They are part of the quality management process and require an analysis of the top factors that drive returns to determine where interventions are required in the process. Outbound KPIs.

article thumbnail

SONAR Indices & Insights: Improve Freight Shipping Procurement with SONAR SCI’s Lane Acuity Plus

FreightWaves SONAR

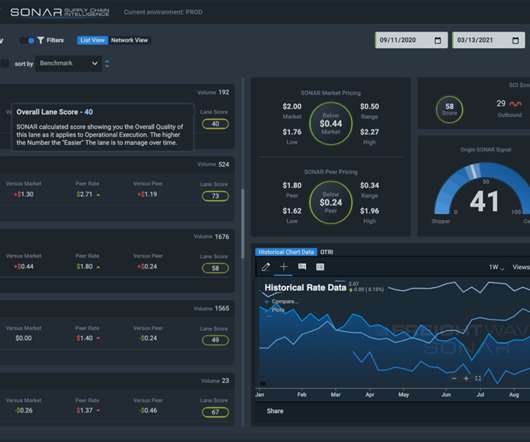
In the screenshot above, you can see that the outbound and inbound stability show scores of 29 out of 100 and 21 out of 100, respectively. harder to procure capacity at the benchmark rate per mile ) in both the outbound and inbound directions. Carriers will be able to see inbound and outbound stability on specific lanes.

article thumbnail

What Shipping Analytics Tools Should Freight Market Participants Have in Their Freight Stack?

FreightWaves SONAR

For example, just-in-time fulfillment models, drop-shipping, and cross-docking avoid wasted space. For example, market conditions show shippers’ rate trajectories. Improved planning through wait time analysis benefits all parties. That includes compliance with the inbound freight routing guide and outbound activities.

article thumbnail

Why CSR-centric Brokerages are Leading the Industry

Parade

For example, managing unforeseen risks and providing customers with visibility. Market intelligence + analysis: carrier pricing, for example, can change at any moment. For example, meet Andrew Prater, Carrier Sales Manager (CSM) for a $1B brokerage.