Remove Analysis Remove Examples Remove Refrigeration Remove Trends
article thumbnail

SONAR Indices & Insights: Plan and Measure Refrigerated Shipping Capacity & Rates

FreightWaves SONAR

This week, learn how freight market participants, especially those freight parties who are executing refrigerated shipping moves, rely on SONAR indices that show reefer freight data and activity. What are the available refrigerated shipping indices in SONAR? Example : ROTVI.ATL was 250 as of August 1. RHAUL.ATL = 50.


article thumbnail

Refrigerated Trucks Are Using Visibility, Productivity & Collaboration Tech to Create High-Value Supply Chains

Turvo

There are many trends and analytics within the shipping and transportation industry that maximize success for the supply chain. Many shipping lines rely on refrigerated trucks and other advanced shipping services. Examples of Tech Used in Supply Chains Today. Real-time tracking of shipments to track delivery times and locations.

Insiders

Sign Up for our Newsletter

This site is protected by reCAPTCHA and the Google Privacy Policy and Terms of Service apply.

article thumbnail

FreightWaves SONAR releases Capacity Trend Indices

FreightWaves SONAR

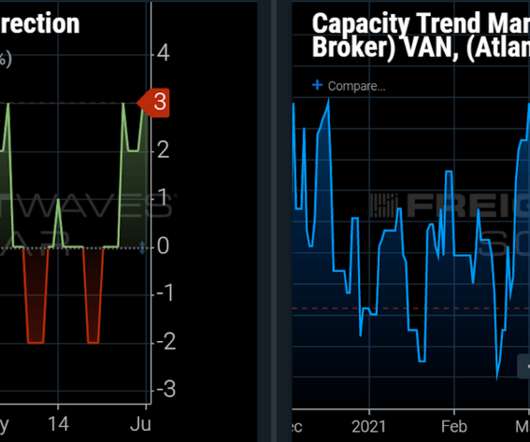
FreightWaves SONAR is releasing new indices – Capacity Trend Market Scores and Capacity Trend Market Direction – to help shippers, carriers and brokers prioritize specific routes daily. Capacity Trend Market Scores Capacity Trend Market Scores are divided into two perspectives – shipper/broker and carrier.

Trends 52
article thumbnail

Guest blog: With the Truck Driver Shortage, How Many More Drivers will be Enough?

CH Robinson Logistics

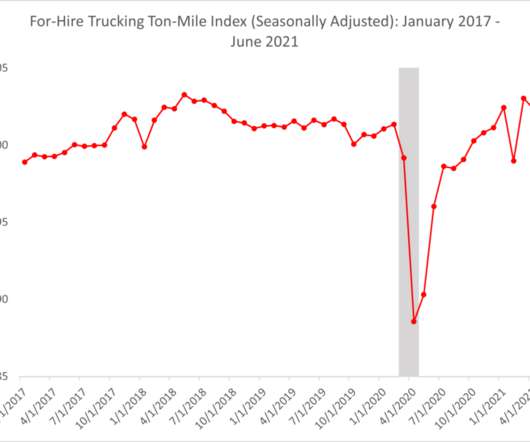
The answer is not simple and involves research and analysis across a number of factors. Robinson’s own technology and data from the largest network in the freight industry, help our customers stay on top of the trends that influence their supply chains. Analysis of employment data. for Q2 2021, relative to Q2 2018.

Trucking 116
article thumbnail

How Cold Chain Logistic Providers Build Trust with Traceability

Logistics Viewpoints

billion in 2020, the cold chain market is expected to reach more than $628 billion in 2028, nearly tripling its growth in less than ten years, according to a market analysis report by Grand View Research. Take tracking produce, for example. Valued at nearly $210.49 Temperature-sensitive products beyond food also rely on traceability.

article thumbnail

DFB Tech Stack: Making the Most of Truckload Rate Benchmarks

Parade

Able to track freight and carrier rates in real-time, truckload pricing tools make it possible for you to set competitive rates for all types of freight -- be it dry-van, refrigerated, or flatbed. You can see pricing trends geographically, which allows you to set realistic prices for individual lanes. Identify Regional Trends.