Remove Analysis Remove Article Remove Data Remove Demo
article thumbnail

Big data and inventory management

EazyStock

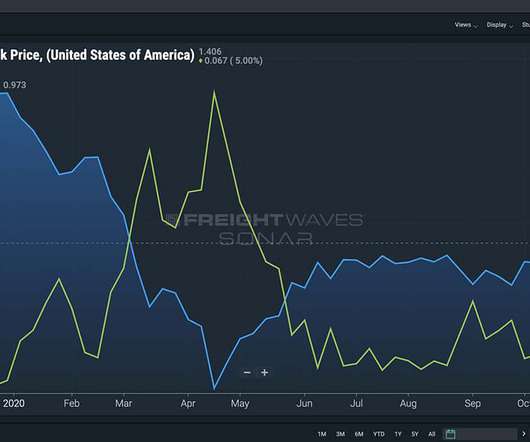
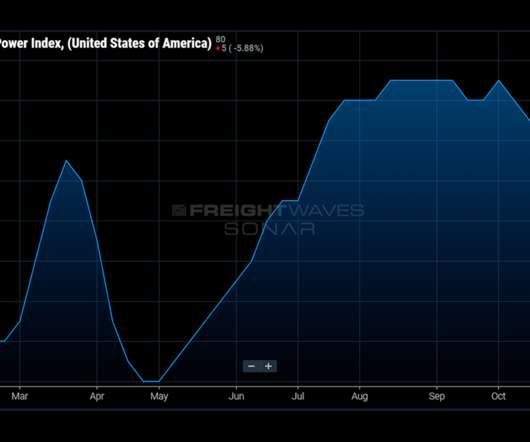
What is big data? All successful businesses use data to develop strategies and review their outcomes. But as the number of systems being used increases, the amount of data available for consumption and analysis grows exponentially. Unstructured data isn’t as accessible to search or export and is often text-heavy.

article thumbnail

How do you forecast lumpy demand?

EazyStock

Historical data trends and market knowledge of how demand can fluctuate are often used to forecast inventory demand. Different demand types or classifications If you analyze the historical sales data of every product in your warehouse, you’ll find that the demand for different items varies considerably. appeared first on.

Insiders

Sign Up for our Newsletter

This site is protected by reCAPTCHA and the Google Privacy Policy and Terms of Service apply.

Trending Sources

article thumbnail

SONAR Indices & Insights: Measure diesel fuel price volatility and market impacts with FUELS and ULSD rack data

FreightWaves SONAR

This week, learn how freight market participants, especially trucking carriers , rely on both the Ultra-Low Sulfur Diesel Rack (ULSDR) data index and the FUELS index to measure diesel fuel price volatility and to understand its impact on their operations and the freight market at large. What are the ULSDR data and FUELS indices?

article thumbnail

Are You Hesitant to Make the Move to a TMS?

Trinity Logistics

If you’re reading this article, more than likely you’re interested in a TMS but are hesitant. Without proper reporting from a TMS, it can be hard to gather data to determine which carrier was the cheapest throughout this past year. GET MY FREE SUPPLY CHAIN ANALYSIS. SCHEDULE A RISK-FREE LIVE DEMO. We understand.

article thumbnail

How do you forecast lumpy demand?

EazyStock

Historical data trends and market knowledge of how demand can fluctuate are often used to forecast inventory demand. Different demand types or classifications If you analyze the historical sales data of every product in your warehouse, you’ll find that the demand for different items varies considerably. appeared first on EazyStock.

article thumbnail

SONAR Indices & Insights: Measure whether shippers or carriers have control of freight pricing with SONAR’s Pricing Power Index

FreightWaves SONAR

In this article, you learn what the Pricing Power Index is, what it may tell various freight market participants, and what the Pricing Power Index can do for each freight market participant. . Click the button below to g et a demo of SONAR to see what the platform can do for you. Request a SONAR Demo.

article thumbnail

Artificial intelligence and machine learning in supply chain management

EazyStock

AI can adapt in near-real-time to changing conditions and develop new knowledge by processing more data and revealing more patterns and trends than humans can. Using regularly gathered data, it notices patterns and suggests the next actions. It uses algorithms, software, or systems to learn and adjust without specific programming.