Remove Demo Remove Examples Remove Industry Remove Outbound
article thumbnail

The four factors that impact freight trucking revenue and profitability

FreightWaves SONAR

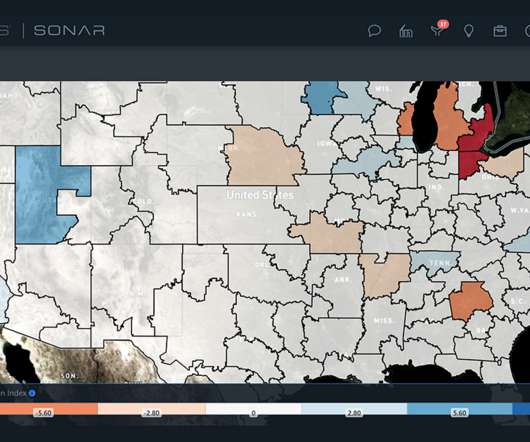
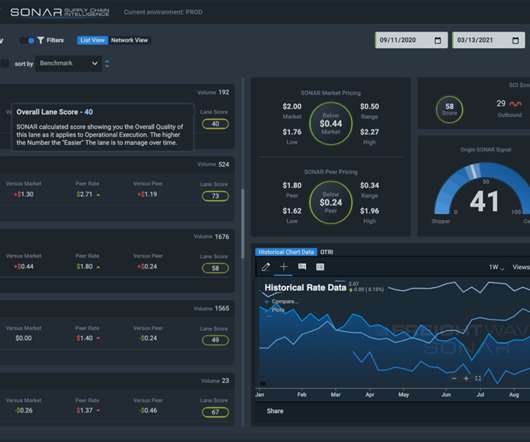
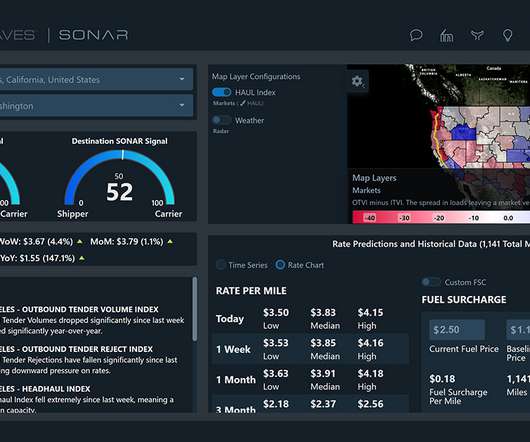
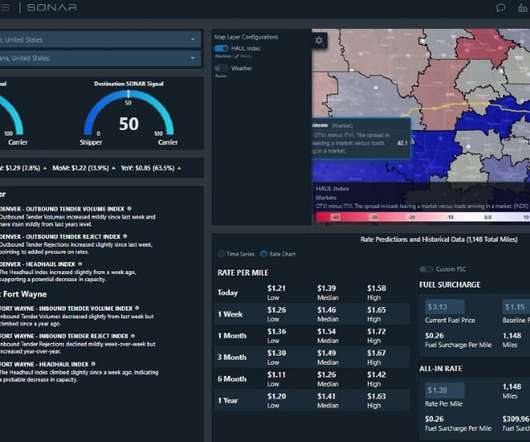
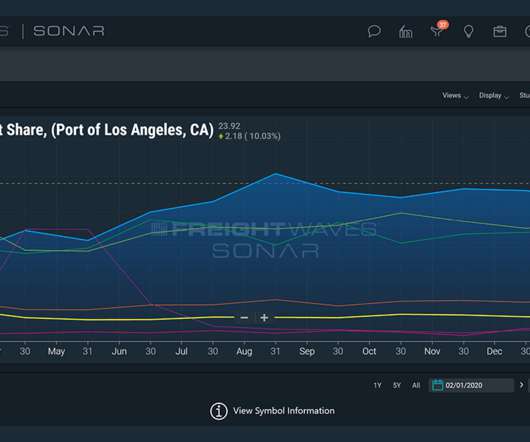
Leading metrics for tracking overall and market-specific activity include: Inbound and outbound load daily change rates, like the Outbound Tender Volume Index (OTVI) in FreightWaves SONAR. Freight market share over the last week, such as SONAR’s Outbound Tender Market Share (OTMS). Request a SONAR Demo.

article thumbnail

SONAR Indices & Insights: See changes in capacity and a sense of shipping rates with the Weighted rejection index (WRI)

FreightWaves SONAR

The WRI combines outbound tender market share (OTMS) and the weekly change in tender rejection rates (OTRIW). For example Atlanta’s OTMS value is 4% and outbound rejections increased from 3% to 5% over the past seven days. Various market participants in the freight industry can rely on the WRI heatmaps in different use cases.

Insiders

Sign Up for our Newsletter

This site is protected by reCAPTCHA and the Google Privacy Policy and Terms of Service apply.

Trending Sources

article thumbnail

Making your carrier sales team as powerful as your customer sales team

FreightWaves SONAR

The freight brokerage industry has traditionally focused its attention on the training and development of its customer sales staff. Shippers will not be willing to accept a lack of trucking capacity or last-minute price changes in an industry that is becoming more transparent. Photo: Jim Allen/FreightWaves at Edge Logistics.

article thumbnail

SONAR Indices & Insights: Improve Freight Shipping Procurement with SONAR SCI’s Lane Acuity Plus

FreightWaves SONAR

In the screenshot above, you can see that the outbound and inbound stability show scores of 29 out of 100 and 21 out of 100, respectively. harder to procure capacity at the benchmark rate per mile ) in both the outbound and inbound directions. This data has been collected over a 4 year period, broken down into shipper industry cohorts.

article thumbnail

What Shipping Analytics Tools Should Freight Market Participants Have in Their Freight Stack?

FreightWaves SONAR

For example, just-in-time fulfillment models, drop-shipping, and cross-docking avoid wasted space. For example, market conditions show shippers’ rate trajectories. Transportation only provides a partial picture of an industry. That includes compliance with the inbound freight routing guide and outbound activities.

article thumbnail

Which is better for fleet assets? Contract or spot freight?

FreightWaves SONAR

Unfortunately, disruption and market volatility – sudden changes within the industry – will often have a dramatic effect on the spot market. Freight management remains an industry in which balance reigns supreme. As the industry moves past the anniversary of the initial U.S. Request a SONAR Demo. trucking market.

article thumbnail

How freight brokers can use SONAR to lower carbon emissions

FreightWaves SONAR

The Environmental Protection Agency (EPA) found that 34% of carbon dioxide emissions come from transportation, but simply switching fuel sources is not going to eliminate the industry’s carbon footprint. For example, let’s examine a load going from Denver, Colorado to Fort Wayne, Indiana.