Remove Data Remove Demo Remove Outbound Remove Presentation
article thumbnail

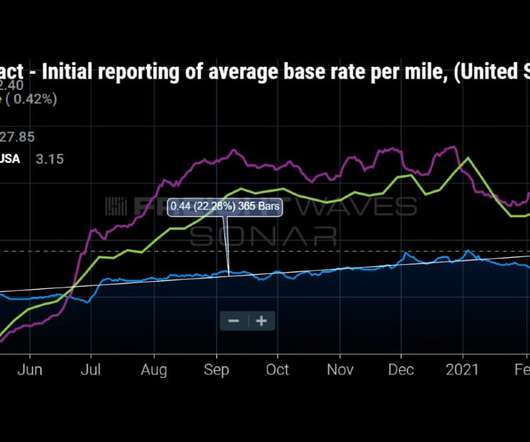
Why data is critical to freight routing guide compliance

FreightWaves SONAR

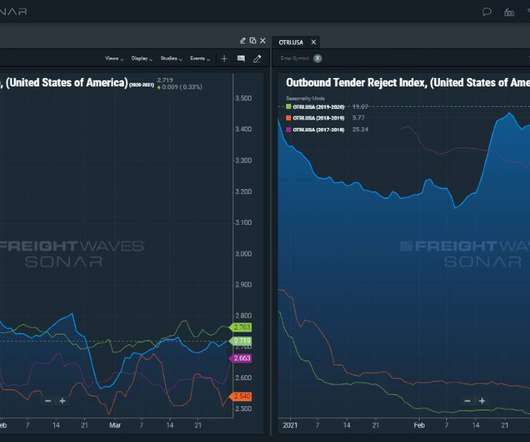
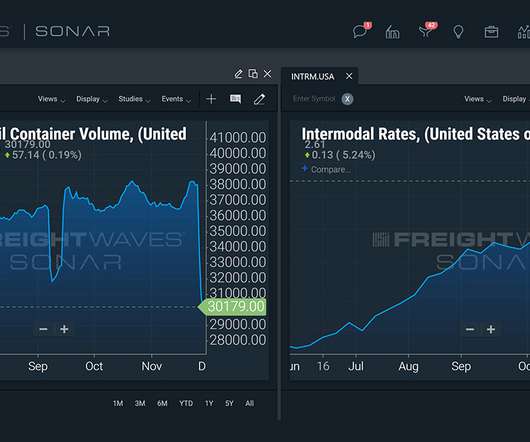
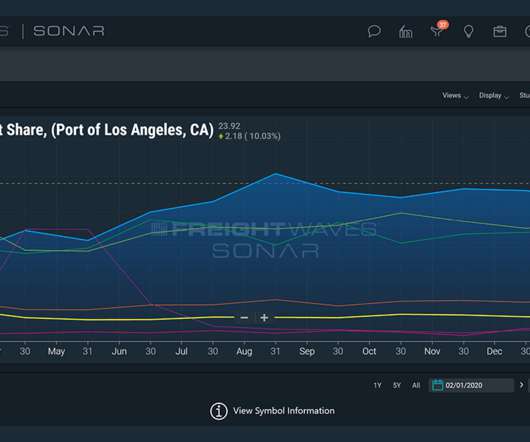
This is done by presenting in-depth insights in an effective manner, such as with an easy-to-view ticker lineup, such as seeing OTLT.USA compared to OTRI.USA side-by-side, but that can only go so far in helping to alleviate concerns with routing guide compliance. Download the White Paper.

article thumbnail

Why data source matters to accurately and objectively assess the over the road trucking market

FreightWaves SONAR

The digital age has presented a wealth of opportunities for the over the road trucking market. The abundant data sources can make the process of assessing the market more difficult than necessary. Shippers and carriers should make more definitive decisions in selecting their data sources. Download the White Paper.

Insiders

Sign Up for our Newsletter

This site is protected by reCAPTCHA and the Google Privacy Policy and Terms of Service apply.

Trending Sources

article thumbnail

Playbook – How to handle rising transportation costs?

Log-hub

As per the ATRI data, the overall marginal expenses for trucking marked a significant of 21% increase in the year 2023. Handling rising transportation costs with Network Design Optimization Apps Within the Network Design App , we focus on optimizing the outbound process. We witnessed a significant increase in the transportation costs.

article thumbnail

Supply Chain Intelligence: The Value of AI and Machine Learning to Predict Freight Rates

FreightWaves SONAR

According to Derrick Steiner of Digitalist Magazine , “Today’s leading companies are working very hard to be intelligent enterprises, capable of harnessing the power of end-to-end experience and operational data, to connecting their demand chain with their customers, who are social, mobile and shop in many channels, to their supply chain.

article thumbnail

[Chart of the Week] Transportation costs keep rising as service deteriorates: Carrier trucking compliance levels drop below 75% while rates increase 6% in February

FreightWaves SONAR

Chart of the Week : Van Contract Base Rate per Mile Initial, Van Outbound Tender Reject Index , Truckstop Average Van Spot Rate per Mile – USA SONAR: VCRPM1.USA, Some mean reversion is imminent, but the national Outbound Tender Reject Index shot back over 28% this week, near its peak value around Thanksgiving of this past year.

article thumbnail

How quickly the market turns

FreightWaves SONAR

This backdrop presented a bright outlook for carriers during the first two months of 2022. FreightWaves SONAR, Outbound tender volume levels downward decline accelerates. This indicates that the spot market that once presented fruitful opportunities for carriers is starting to dry up. Request a SONAR Demo.

Demo 52
article thumbnail

[Chart of the Week] Produce season comes early: February storm aftermath causes reefer capacity crunch ahead of schedule

FreightWaves SONAR

Chart of the Week: Reefer Outbound Tender Reject Index – USA, USDA Produce Truckload Spot Rate – Los Angeles to Dallas, Reefer Outbound Tender Reject Index – Los Angeles SONAR : ROTRI.USA, AGRATE.LAXDAL, ROTRI.LAX It is widely known at this point that the winter plunge that hit the central U.S. Request a SONAR Demo.