Remove category
article thumbnail

What shippers need to know about how carriers price freight with historic, peer and market data

FreightWaves SONAR

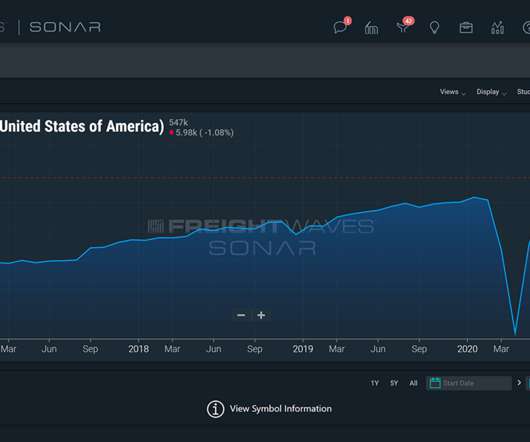
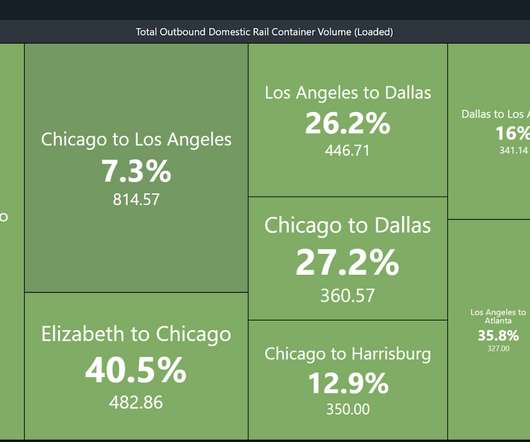
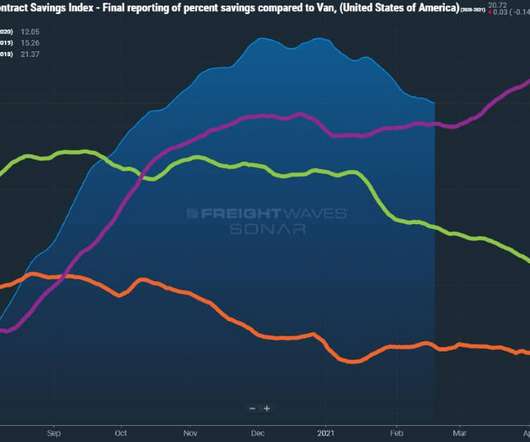
But knowing what’s happening based on historic, peer and market data can help shippers figure out how carriers price freight loads. Here are a few things managers need to keep in mind when working with real-time freight data for pricing purposes. . This factor plays into net revenue per truck per week as well.

article thumbnail

SONAR Indices & Insights: Use the RESL Index to measure retail sales trends to help predict shifts in the freight markets

FreightWaves SONAR

This helps measure the demand for finished goods across a variety of categories such as department stores, furniture stores, electronics and more. The retail sales trends data can be broken out into categories for a more granular understanding of performance in various retail sectors. Request a SONAR Demo.

Trends 98
Insiders

Sign Up for our Newsletter

This site is protected by reCAPTCHA and the Google Privacy Policy and Terms of Service apply.

article thumbnail

Bringing Order to Chaos: Last-Mile Delivery Costs and How to Reduce Them

Locus

Fuel costs: Last-mile fuel costs require careful management as they make up 25% of a truck’s operational costs over volatile price fluctuations. A recent analysis by the American Trucking Associations (ATA) indicates that if existing trends persist, we could see a potential driver shortage reaching up to 175,000 by 2024.

article thumbnail

Retail disruption and K-shaped recovery highlight importance of freight data

FreightWaves SONAR

Using SONAR data in contract negotiations with carriers and 3PLs. . Heightened demand uncertainty with variability by geography and category. In addition, SONAR data could be used by retailers for strategic and longer-term decision-making, such as deciding where to locate warehouses and fulfillment centers. .

article thumbnail

Why shippers care about reduced emissions in their network

FreightWaves SONAR

The impact transportation pollution cause on global supply chain networks A few main categories of pollution and waste can be tied back to local and global supply chain activities and poor integration practices. With the right tools and analytic data in hand, managers can promote a new green initiative throughout the supply chain.

article thumbnail

Load Matching: Optimizing Logistics Efficiency in the Last Mile

Locus

Thirty-five percent of trucks travel empty in the U.S., And according to the National Private Truck Council, 28% of a private fleet’s miles qualify as deadhead. Fuel costs played a major role in driving this surge, soaring by 53.7%, with other expense categories also experiencing double-digit growth.

article thumbnail

7 Freight broker sales tips for setting the hook with prospects

FreightWaves SONAR

3: Freight data. Speaking of keeping on top of trends, using freight market data is another attention grabber that is not as always evident in the list of freight broker sales tips. Whether you’re working from the office or from home, SONAR can provide you the data and intelligence you need to stay ahead of your competitors. .

Tips 59