Remove category
article thumbnail

Bringing Order to Chaos: Last-Mile Delivery Costs and How to Reduce Them

Locus

Fuel costs: Last-mile fuel costs require careful management as they make up 25% of a truck’s operational costs over volatile price fluctuations. A recent analysis by the American Trucking Associations (ATA) indicates that if existing trends persist, we could see a potential driver shortage reaching up to 175,000 by 2024.

article thumbnail

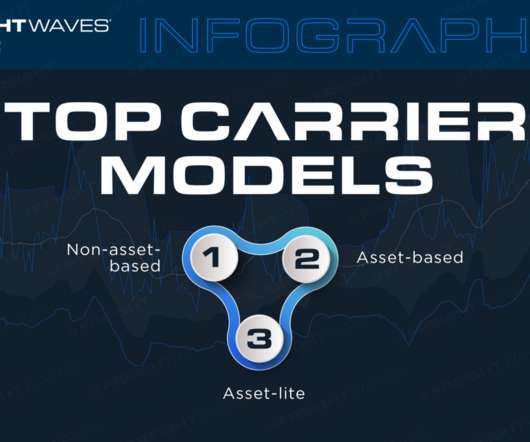
[INFOGRAPHIC] Asset-based freight carriers, lite and brokerage: what are the carrier model types

FreightWaves SONAR

However, some combine and fall within one another’s categories. Of course, it’s important to recognize that these categories are not identical to the four trucking carrier types. And by extension, any non-asset-based broker falls into this category too. Request a SONAR Demo.

Insiders

Sign Up for our Newsletter

This site is protected by reCAPTCHA and the Google Privacy Policy and Terms of Service apply.

article thumbnail

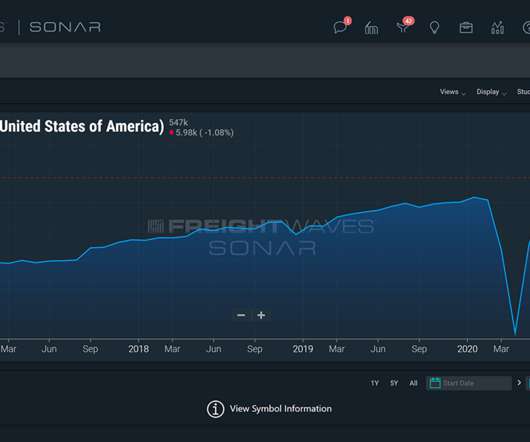
SONAR Indices & Insights: Use the RESL Index to measure retail sales trends to help predict shifts in the freight markets

FreightWaves SONAR

This helps measure the demand for finished goods across a variety of categories such as department stores, furniture stores, electronics and more. The retail sales trends data can be broken out into categories for a more granular understanding of performance in various retail sectors. Request a SONAR Demo.

Trends 98
article thumbnail

What shippers need to know about how carriers price freight with historic, peer and market data

FreightWaves SONAR

The fact remains that within freight transportation protocol, trucking capacity is finite. This factor plays into net revenue per truck per week as well. REVENUE PER DRIVER PER WEEK (DRVREV) – The profits earned per truck each week remains a crucial piece of data for fleet management.

article thumbnail

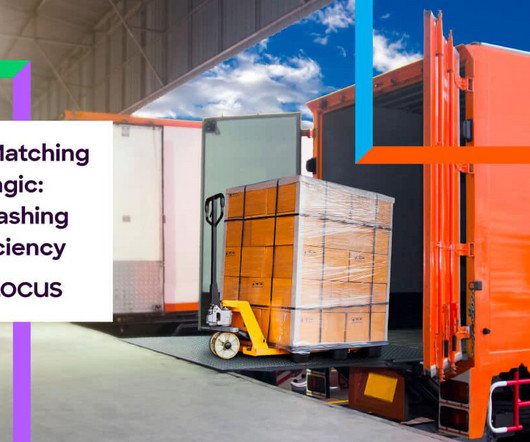
Load Matching: Optimizing Logistics Efficiency in the Last Mile

Locus

Thirty-five percent of trucks travel empty in the U.S., And according to the National Private Truck Council, 28% of a private fleet’s miles qualify as deadhead. Fuel costs played a major role in driving this surge, soaring by 53.7%, with other expense categories also experiencing double-digit growth.

article thumbnail

Why shippers care about reduced emissions in their network

FreightWaves SONAR

The impact transportation pollution cause on global supply chain networks A few main categories of pollution and waste can be tied back to local and global supply chain activities and poor integration practices. Request a FreightWaves SONAR demo to get started. . Request a SONAR Demo.

article thumbnail

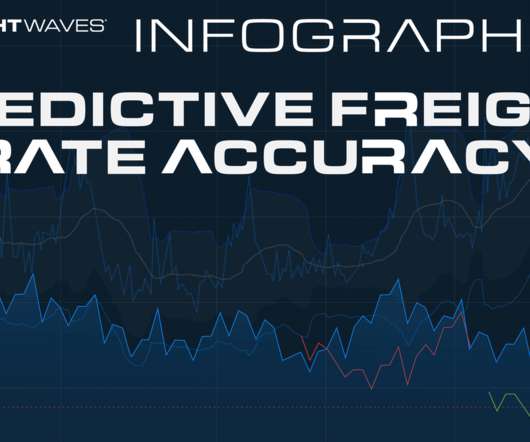
[INFOGRAPHIC] FreightWaves Scientific National Truckload Rates Per Mile show predictive freight rate accuracy

FreightWaves SONAR

Observed] costs result when money is actually spent on the various supplies, services and other expense categories used by the business.” After all, wide deviations within predictive rates can still add up to big trucking revenue changes over a week, month or year. Request a SONAR Demo.

Freight 98