Remove Analysis Remove Demo Remove Inbound Remove Tools
article thumbnail

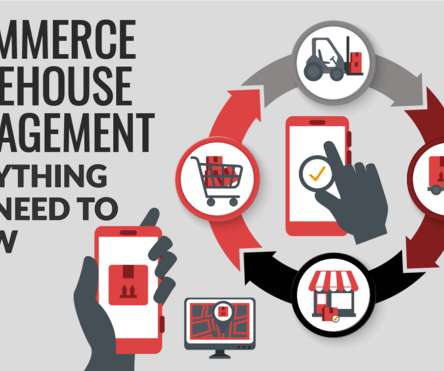
What Shipping Analytics Tools Should Freight Market Participants Have in Their Freight Stack?

FreightWaves SONAR

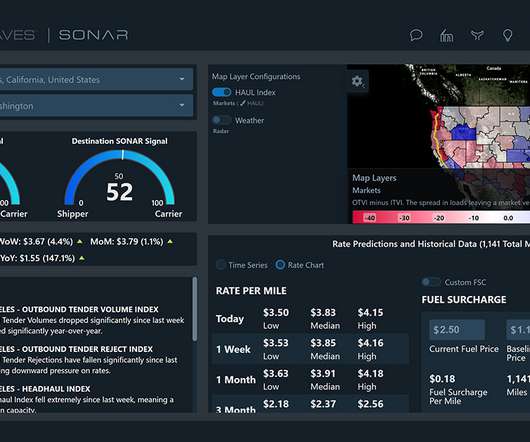
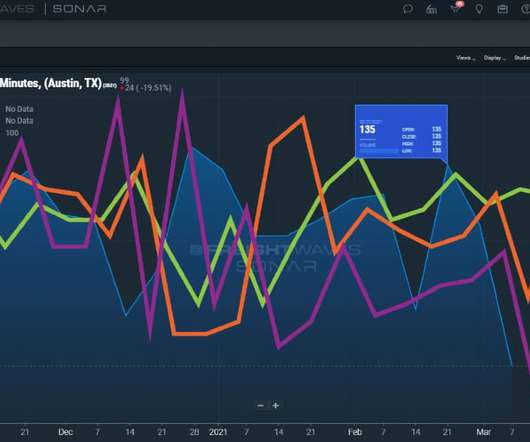
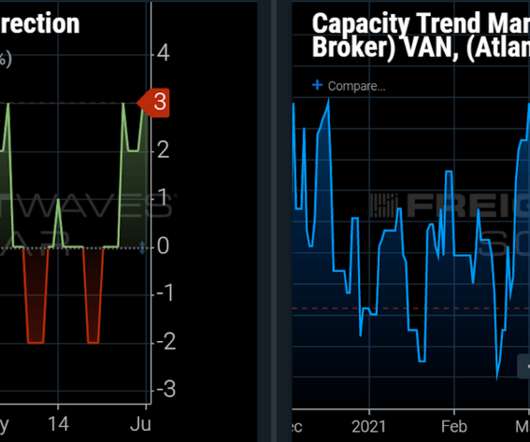
Shipping analytics tools shine a light on the value of informed freight management. Freight market participants need these top shipping analytics tools in their freight stack. Shipping status tools to track freight. Tracking shipment status is a core function of advanced shipping analytics tools. Download the White Paper.

article thumbnail

6 Steps to conduct a freight spend analysis

FreightWaves SONAR

A freight spend analysis can help cut those extra costs. Performing a freight spend analysis reveals extra costs deriving from unforeseen issues. Let’s look at a few best practices and steps to conduct a comprehensive, insightful cost analysis. Know the scope and value of a freight spend analysis.

Insiders

Sign Up for our Newsletter

This site is protected by reCAPTCHA and the Google Privacy Policy and Terms of Service apply.

Trending Sources

article thumbnail

What data is available to track intermodal freight shipping rates

FreightWaves SONAR

One of the most popular tools that drives the supply chain to new heights is the process of intermodal freight shipping. Data access and analysis continue to be essential to competitive operations within the process of monitoring rates and expenses in intermodal shipping lanes. Request a SONAR Demo. Download the White Paper.

article thumbnail

6 Truckload freight spend optimization best practices

FreightWaves SONAR

Knowing the following key tactics and using the proper tools will help sustain long-term savings. Track truckload freight accessorial costs As reported by Inbound Logistics , “Carriers price accessorials, such as liftgate or non-commercial delivery, at a premium. Request a FreightWaves SONAR demo by clicking the button below.

article thumbnail

Connecting the Dots: The Game-Changing Benefits of Supply Chain Visualization

Log-hub

Disruptions in Supply Chain : As a result of the lack of visibility, businesses risk losing control over the inbound supply network. Data-driven Decision-making : Visualization tools aggregate and present data from various sources in a unified manner.

article thumbnail

SONAR Indices & Insights: Improve Freight Shipping Procurement with SONAR SCI’s Lane Acuity Plus

FreightWaves SONAR

In the screenshot above, you can see that the outbound and inbound stability show scores of 29 out of 100 and 21 out of 100, respectively. harder to procure capacity at the benchmark rate per mile ) in both the outbound and inbound directions. Carriers will be able to see inbound and outbound stability on specific lanes.