

May 28, 2024 Update
Freightos
MAY 28, 2024
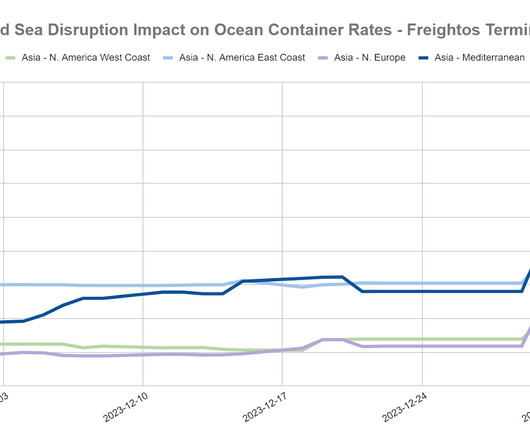
Blog " * " indicates required fields Email * Email This field is for validation purposes and should be left unchanged. May 28, 2024 Weekly highlights Ocean rates – Freightos Baltic Index Asia-US West Coast prices (FBX01 Weekly) increased 13% to $4,917/FEU. Europe prices (FBX11 Weekly) climbed 6% to $4,876/FEU.


Let's personalize your content