Remove Demo Remove Examples Remove Operations Remove Outbound
article thumbnail

The four factors that impact freight trucking revenue and profitability

FreightWaves SONAR

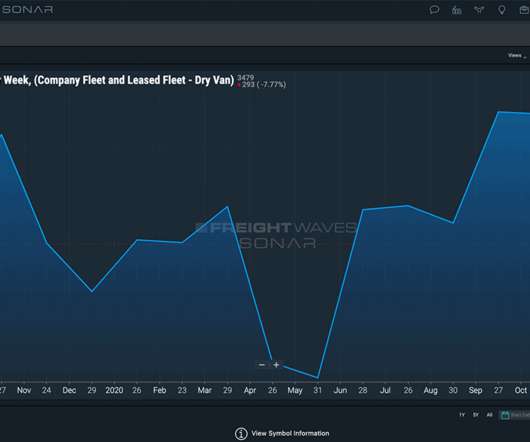
Leading metrics for tracking overall and market-specific activity include: Inbound and outbound load daily change rates, like the Outbound Tender Volume Index (OTVI) in FreightWaves SONAR. Freight market share over the last week, such as SONAR’s Outbound Tender Market Share (OTMS). Operating ratio and company margins (OPRAT).

article thumbnail

7 ways freight tech reduces operations costs and improves profits for carriers

FreightWaves SONAR

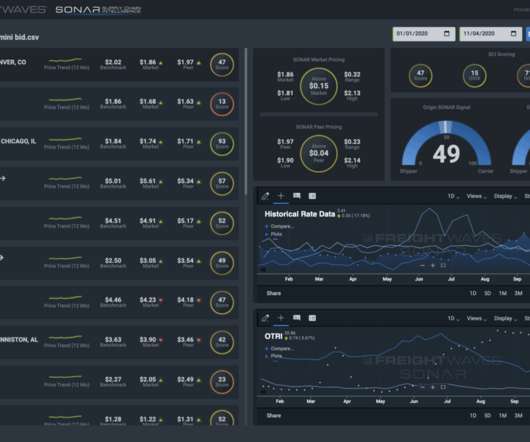
Operational costs continue to increase for carriers year to year. Although many carriers have worked diligently towards reducing operational costs and increasing profit margins, there is still work to do for the top for-hire truckload freight carriers to improve. Operating Ratio. Freight data reduces dwell time and load time.

Insiders

Sign Up for our Newsletter

This site is protected by reCAPTCHA and the Google Privacy Policy and Terms of Service apply.

Trending Sources

article thumbnail

Supply Chain Intelligence: The Value of AI and Machine Learning to Predict Freight Rates

FreightWaves SONAR

According to Derrick Steiner of Digitalist Magazine , “Today’s leading companies are working very hard to be intelligent enterprises, capable of harnessing the power of end-to-end experience and operational data, to connecting their demand chain with their customers, who are social, mobile and shop in many channels, to their supply chain.

article thumbnail

Making your carrier sales team as powerful as your customer sales team

FreightWaves SONAR

In a recession market, there is pressure to operate efficiently and maximizing asset utilization. . Lane Signal considers the following indices: Outbound Tender Volume Index Outbound Tender Rejection Index Headhaul Index for both origin and destination Inbound Tender Volume Index Inbound Tender Rejection Index.

article thumbnail

How freight brokers can use SONAR to lower carbon emissions

FreightWaves SONAR

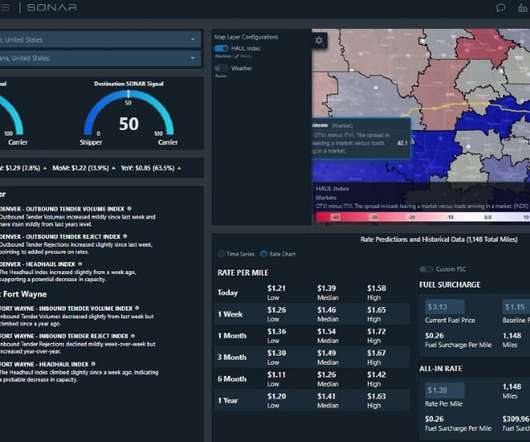
For example, let’s examine a load going from Denver, Colorado to Fort Wayne, Indiana. As a carrier representative, you are mildly excited because the outbound market of Denver is more in your favor. This is a perfect example of how we can lower carbon emissions and improve carrier capacity.

article thumbnail

Which is better for fleet assets? Contract or spot freight?

FreightWaves SONAR

It is a complex process, and it is important for carrier operations managers to understand how contract versus spot affects asset allocation. Request a FreightWaves SONAR demo by clicking the button below. Request a SONAR Demo. The problem with poor asset allocation between contract and spot freight. trucking market.

article thumbnail

[INFOGRAPHIC] Top KPIs in Supply Chain for Warehouse, Logistics, Transportation, Freight

FreightWaves SONAR

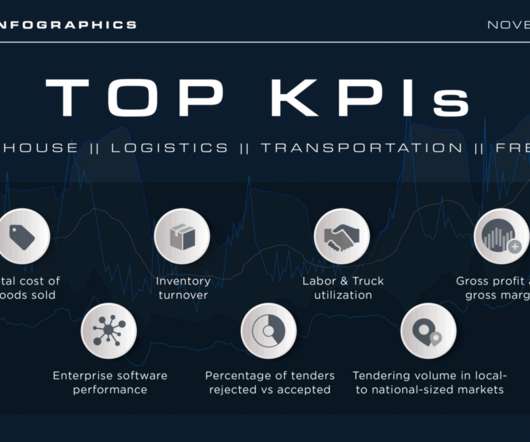
As an example, Supply Chain Dive states, “Minimizing the number of claims for overages, shortages and damages (OS&Ds) as a percentage of deliveries,” is one way to manage operations and track performance better. Request a SONAR demo online to learn more. That much is clear. Full KPIs in Supply Chain Infographic.