Remove Demo Remove Outbound Remove Presentation Remove Trends
article thumbnail

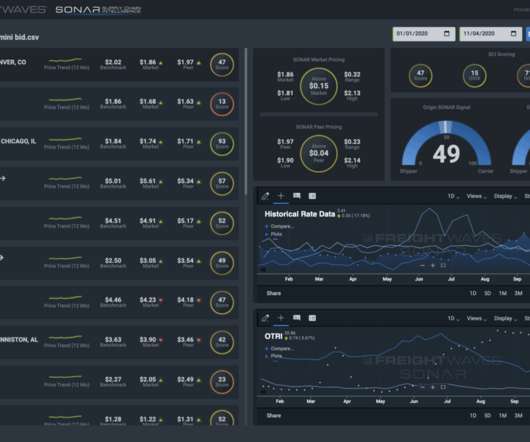
Supply Chain Intelligence: The Value of AI and Machine Learning to Predict Freight Rates

FreightWaves SONAR

Yes, AI and machine learning build on algorithms to isolate historical trends and derive a likely transportation rate. And the past data trends are obsolete and rapidly becoming more so. Find out more about the possible insights that could help your business by requesting a SONAR demo online today. Request a SONAR Demo.

article thumbnail

How quickly the market turns

FreightWaves SONAR

This backdrop presented a bright outlook for carriers during the first two months of 2022. FreightWaves SONAR, Outbound tender volume levels downward decline accelerates. The decline in rejection rates in March and April of this year have accelerated the downward trend – despite contract rate flattening out in April.

Demo 52
Insiders

Sign Up for our Newsletter

This site is protected by reCAPTCHA and the Google Privacy Policy and Terms of Service apply.

Trending Sources

article thumbnail

2021 Truck industry disruption factors: how to continue with operational excellence and profitability (part 2)

FreightWaves SONAR

With Pfizer and other manufacturers focused on getting vaccine doses out through the big three carriers, there’s simply not a lasting need to worry at present. Part of that data includes invaluable indices, such as the Outbound Tender Reject Index (OTRI) in FreightWaves SONAR. Request a SONAR Demo.

article thumbnail

Freight Business: Use SONAR indices to diversify your freight brokerage portfolio with port shipments

FreightWaves SONAR

The time period for the SONAR chart is from January 2020 to the present. In this SONAR chart, you can see the comparisons of trends seen in the previous SONAR PIMS ticker. . When you click the individual lanes within this tool, you can view trends of the individual maritime lanes, including the Panama spread.

Freight 72
article thumbnail

SONAR Indices & Insights: Monitor Intermodal Shipping Container Volumes with RAIL & Domestic Intermodal Spot Rates with INTRM

FreightWaves SONAR

ORAIL and IRAIL are broken down by inbound and outbound volume origin/destination market and are also broken down by lane. Analysts : Analysts can utilize ORAIL data to gain visibility into intermodal shipping volume trends in particular industry granularities (e.g., Get a demo of SONAR to see what the platform can do for you.