2022 Warehouse/DC Operations Survey: Recalibrating operations and spending
Capital expenditure expectations for the coming year declined, though there are still signs of sizable automation budgets and interest in warehouse technology. The bigger picture revolves around continued struggles with upstream supply chains, inventory management and space.
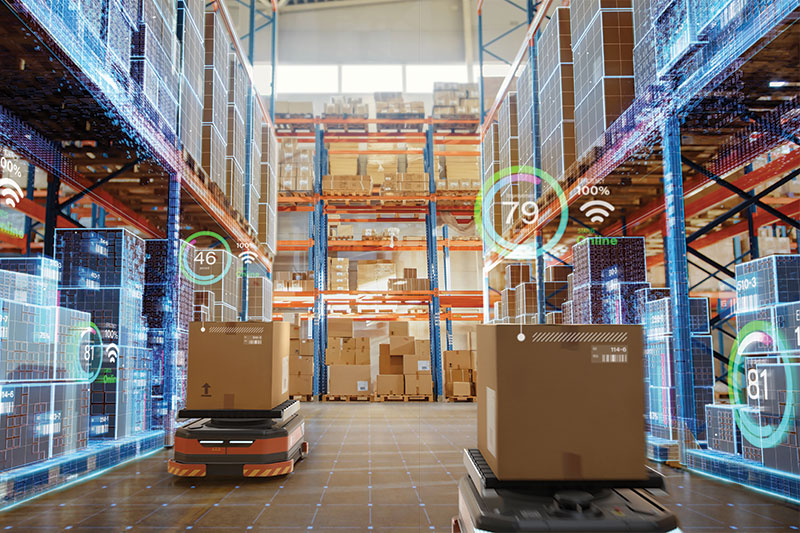

The main findings of our annual “Warehouse Operations & Trends Survey” have been consistent the last few years: rising budgets for warehouse and distribution center (DC) automation, coupled with deep concern about being able to find and retain warehouse staff.
This year’s pool of respondents—readers involved with running warehouse and DC operations—now have other concerns that topped the staffing issue, and when we asked about capital expenditure (capex) plans for the coming year, it was lower than last year.
This year’s respondent pool did have more smaller companies in the mix than last year; but nevertheless, it broke a string of three straight years of the survey in which the capex outlook question showed growing budgets. Could this be the winds of change?
The survey, conducted annually by Peerless Research Group (PRG) on behalf of Logistics Management and sister publication Modern Materials Handling, asks about operational factors at warehouses and DCs, such as size of the DC network, number of employees, average annual inventory turns, use of temporary labor, strategies for coping with peak demand, and other challenges such as finding and retaining labor.
This year for the first time, we asked about “supply chain disruptions, particularly with China” as an operational challenge, and it became the leading concern, topping the struggles with staffing. The survey was in the field during September 2022, a tumultuous month for the global economy, with rising interest rates and inflation, and also energy cost and supply concerns tied to the ongoing war in Ukraine.
Nature of DC’s inbound/outbound operation
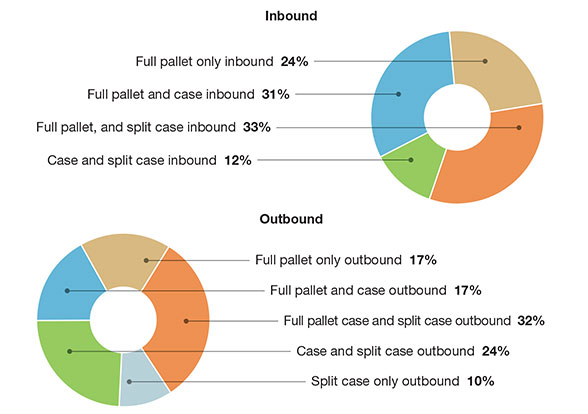
Source: Peerless Research Group (PRG)
Size of distribution center network: Number of buildings
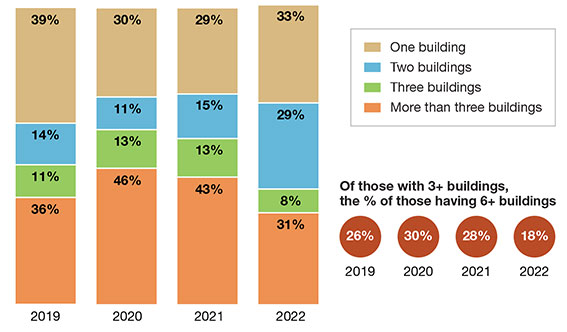
Source: Peerless Research Group (PRG)
View from the top
Given this backdrop, it’s perhaps not surprising that some respondents are being more conservative on their warehouse/DC automation plans this year.
At the same time, the survey reflects how years of supply chain disruption comes home to roost in DC networks, with more congestion in receiving and more respondent companies tapping into temporary space at peak. On the plus side, many respondents have substantial automation budgets, and there was rising interest in the use of warehouse IT.
Size of distribution center network: Total square footage
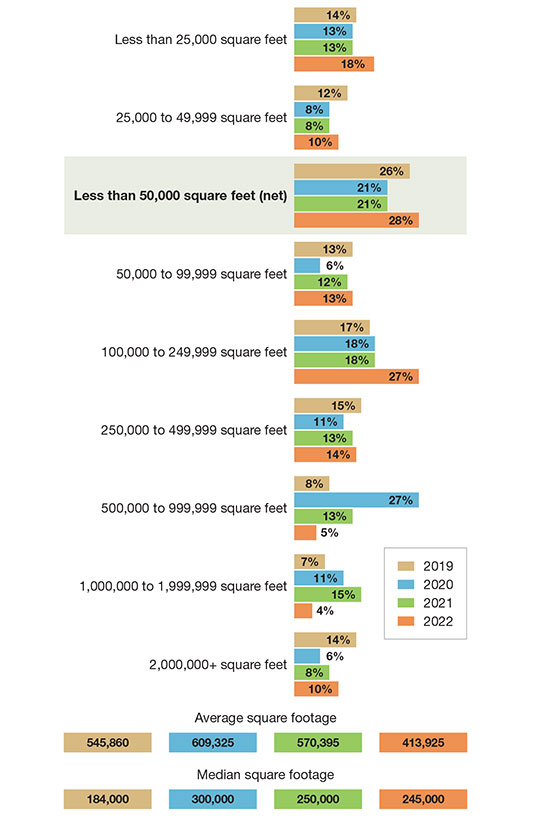
Source: Peerless Research Group (PRG)
In short, the automation trend is ongoing, but macroeconomic factors, like higher interest rates and rising costs, do eventually have some impact, notes Don Derewecki, a senior consultant with St. Onge, a supply chain engineering and consulting company. Derewecki, along with Norm Saenz, Jr., managing director and a partner with St. Onge, reviewed the survey’s findings to give us added perspective.
“There does seem to be a more cautious approach this year, which could be tied to concerns about rising interest rates,” says Derewecki. “But in the grand scheme of things, from what we see in the industry, many organizations are still spending on automation. Some might not be buying major new systems today, but they want to know where the technology is going and what it can do in their operations, because in the long term, there just aren’t enough workers who want to pick cartons and cases all day to meet order fulfillment needs.”
Order fulfillment work for today’s DC includes plenty of e-commerce orders, which when done without automation, involves labor intensive picking and packing processes. The 2022 survey found, for instance, that 41% of respondents service e-commerce, up from 37% last year, and 28% saw their e-commerce channel grow by between 20% to 29%, which is 7% higher than last year.
There was also a trend toward less square footage in the network, which may have to do more with smaller companies in the response pool this year, but may also be tied to companies adjusting their DC networks.
“There’s a lot of re-assessing of what to do next,” says Saenz. “Some people are backing up and asking: Do I have the right number of buildings in my network, or the right size of buildings? Maybe I can consolidate and then automate more processes within in a larger facility, because there’s more volume in that building?”
Operational changes
As mentioned previously, e-commerce grew as a channel, 41% this year, up from 37% the previous year. Those supporting omni-channel fulfillment declined from 40% last year to 29% this year, but still, that means a combined 70% identify with supporting one or both of those channels.
Wholesale remains the most common channel, supported by 53% this year, up slightly from 51% last year. Retail as a channel was named by 34%, down from 45% last year. Additionally, 18% are with companies involved with micro-fulfillment customer pickup, and 15% handle micro-fulfillment with delivery to customers, both slightly lower than last year.
The nature of respondents’ inbound and outbound operations saw some changes, including growth in full-pallet only on both the inbound and outbound sides. On the inbound side, 24% are handling full pallet only, up from 15% last year, while 31% are handling full pallet and case, up from 26%.
Size of distribution center network: Clear height of buildings
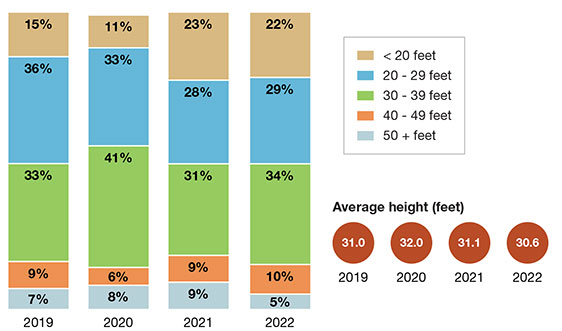
Source: Peerless Research Group (PRG)
On the outbound side, full-pallet only reached 17% this year, up from 14%, while 17% said they ship full pallet and case outbound, down from 20%. Other changes on the outbound side include full pallet, case, and split case dropping from 50% last year, to 32% this year, while outbound case and split handling reached 24%, up from 17%, and split case only reached 10%.
It’s likely that continued supply chain disruptions are causing more companies to buy in larger quantities than ideal, notes Derewecki. “For years companies were able to rely on that continuous flow of goods in smaller quantities, and now that same level of confidence isn’t there,” he says.
Space utilization: The most congested area in warehouses
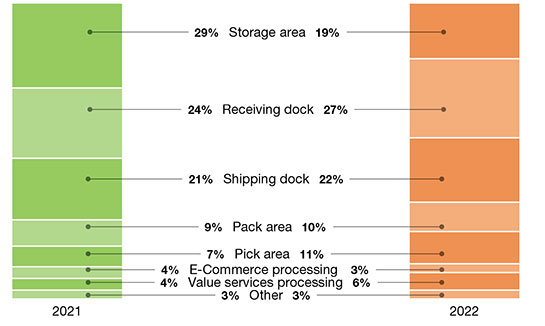
Source: Peerless Research Group (PRG)
When we asked about the most congested areas in a warehouse, for 2022, 27% named receiving, up from 24% last year and 18% back in 2020. However, congestion in the picking area also grew slightly—from 7% who named picking the most congested area last year, to 11% this year.
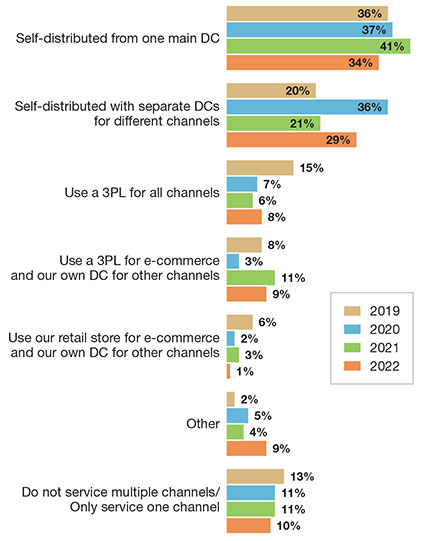
When asked how multiple channels are being fulfilled, the most common strategy remains to self-distribute from one main DC, named by 34% of respondents, but this is down from 41% last year. Among this year’s respondents, the big gain versus last year was from the 29% who said they self-distribute using separate DCs for different channels, up from 21% last year.
In terms of total square feet in entire the DC network, the average square footage was 413,935 square feet, down sharply from 570,395 square feet in 2021. However, the median only dropped from 250,000 square feet to 245,000 square feet, and this year, the respondent pool trended slightly smaller, with the median annual revenue of a respondent company dropping from $120 million to $100 million.
Distribution center expansion plans
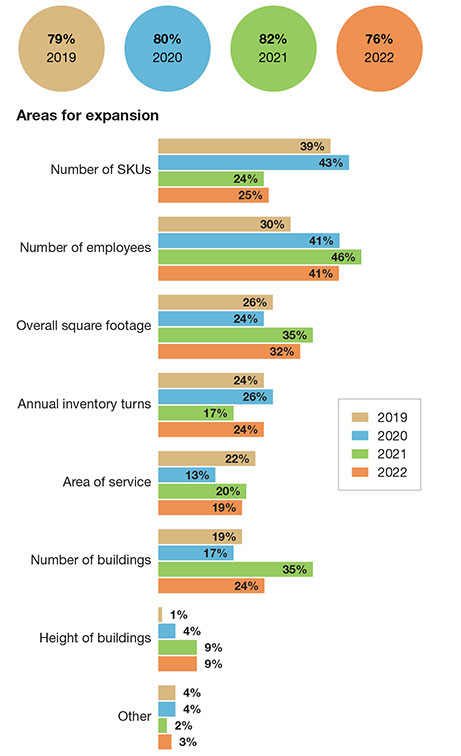
Source: Peerless Research Group (PRG)
However, when we asked about the most common square footage in the network, the overall average increased slightly, from 157,650 square feet last year, to 169,550 square feet this year. Thus, the finding was a bit less space in the overall network, likely tied to a bit more smaller companies in the respondent mix, but some relatively large facilities within those networks.
The findings on number of buildings in the DC network shifted. This year, 29% said they had two buildings in the networks, up from 15% last year, while those saying that they had more than three buildings declined from 43% last year to 31% this year. Of those with three or more buildings, 18% have six or more DCs, a drop from 28% last year.
The findings on clear heights of buildings stayed fairly stable. This year, the average clear height, given the ranges presented, was 30.6 feet, just a bit lower than last year’s 31.1 feet.
There was a 3% increase from those respondents with an average clear height of 30 feet to 39 feet. There was a big drop in the average number of employees at the main DC this year—from 150 on average last year, to only 75 this year. Again, this likely has to do with a different respondent mix. For 2022, 27% said they had between 25 employees and 49 employees, making that the most common choice, though 22% have between 200 employees and 299 employees at the main site.
Inventory issues
The encouraging news on inventory is that there was a slight increase in inventory turns, even as average SKU counts increased.
This year, average annual turns came in at 7.1, up from 7.0 turns last year, though down from 8.2 average annual inventory turns back in 2019 and 2020. Meanwhile, the average SKU count climbed from 9,376 last year to 10,371 this year.
It should be noted, however, that average SKU count has been higher in previous PRG surveys, including 12,922 as recently as 2020. This may be related to supply shortages during the pandemic, which may have contributed to a refocus around core SKUs to satisfy basic consumer demands, even if the long-term trend is to hold and distribute a wider mix of SKUs to satisfy the whims of e-commerce.
Companies expressed interest in improving inventory turns. When asked about expansion plans in another part of the survey, 24% said they want to increase turns, up from just 17% last year, and more in line with the 26% who wanted to improve upon turns back in 2020.
Market channels serviced by company
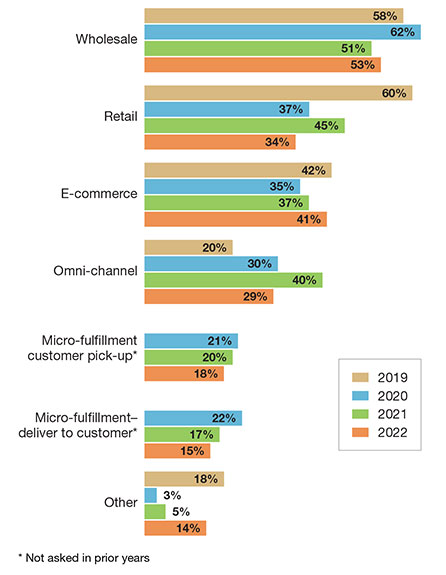
Source: Peerless Research Group (PRG)
Inventory needs space, and our survey this year pointed toward a space crunch in DC operations, as well as using more temporary help during peak. This year, in terms of peak warehouse space utilization, the average increased only slightly—from 85.4% last year to 85.6% this year. However, there were a combined 37% who reported more than 95% utilization at peak.
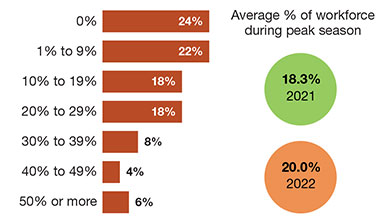
When it comes to the percentage of workforce who are temps during peak volume, the average this year reached 20%, up from 18.3% last year. We also asked a separate question about methods of finding temporary workers, with temp agencies and staffing agencies being the leading sources. We also found that 13% are tapping “gig worker” platforms—the first time the survey has offered that as a response.
“The need to be creative in finding enough labor resources is definitely something we see in the industry,” says Saenz. “If a company can’t automate in the short term, then they have to be creative in finding enough labor, and effective in how they plan for their labor needs.”
Expansion and e-commerce
In terms of overall expansion plans, 76% are planning some type of expansion, down from 82% last year. This year, 32% said that they plan to expand square footage in the next 12 months, down from 35% last year. The bigger decline is with the number of buildings. Only 24% said that they want to expand the number of buildings in the network, down from 35% last year. Forty-one percent plan on increasing the number of employees, down from 46% last year.
Percent of workforce who are temporary during peak volume periods
Source: Peerless Research Group (PRG)
E-commerce fulfillment is generally more labor intensive than wholesale or retail fulfillment, with more handling of single items. When we asked about growth ranges for e-commerce, this year 28% said it increased by 20% to 29%, up from 21% who experienced that level of growth last year. Another 9% said their e-commerce channel topped 60% growth this year.
This year, we pared back our questions around COVID health and safety measures, given the availability of vaccines and the end of government restrictions in most of North America. However, we did find that only 7% has taken no actions on COVID prevention since the start of the pandemic. Fifty percent said they had taken multiple health and safety measures since the start of the pandemic, but had suspended them due to lower risk levels.
In terms of other catastrophic events (Hurricane Ian had not yet hit when the survey was in the field), this year we found that 32% had experienced a catastrophic event, down from 36% last year.
Systems and challenges
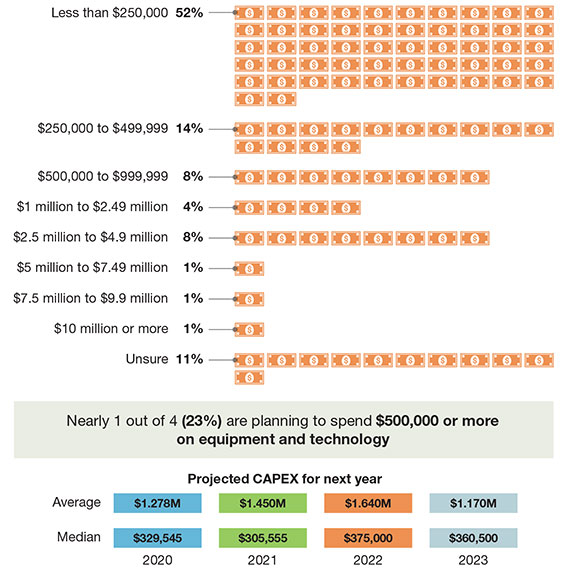
As mentioned previously, projected capex for warehouse equipment and technology for the coming year took a dip this year. This year, respondents had an average capex projection of $1.17 million for the coming year, down from an average of $1.64 million last year.
How multiple channels are being fulfilled
Source: Peerless Research Group (PRG)
However, the median was down less steeply, from $375,000 last year to $360,500 this year, and many respondents have sizable budgets. We found this year that nearly one in four respondents (a combined 23%) are planning to spend $500,000 or more on equipment and technology.
We always ask about warehouse management systems (WMS) in use. This year, 79% said they use some type of WMS, down from 83% last year. The most frequently cited type of WMS remains a WMS module of an enterprise resource planning (ERP) system, followed by legacy or in-house developed WMS. There was a slight dip in those saying they use a best of breed WMS (10% this year versus 14% in 2021), and we also saw a 4% increase in use of labor management system (LMS) functionality.
The survey also found a move away from reliance on paper-based order picking methods, which fell from 59% last year, to 53% this year, while use of radio-frequency (RF) handhelds for digital and wireless order picking rose from 45% to 50%. Voice declined to 6% after having been as high as 14% a couple of years back.
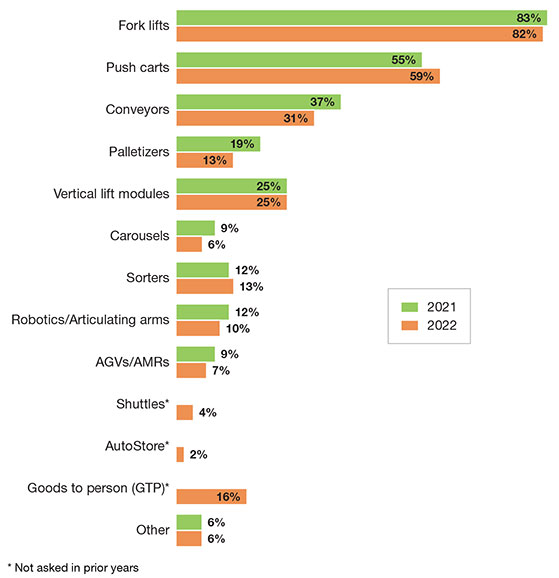
In terms of materials handling systems in use, this year we added “goods-to-person” (GTP) as a new option, and found 16% use GTP solutions. Most other system types stayed fairly stable, with a slight decline in those reporting use of autonomous mobile robot (AMR) or automated guided vehicles (AGVs), which came to 7% this year compared to 9% last year.
Estimated capital expenditures for warehousing equipment and technology in 2022
Source: Peerless Research Group (PRG)
Our annual survey traditionally asks about actions taken to lower operating cost. For 2022, the survey found that 92% have taken some form of action to lower costs, down from last year’s 98%.
There were slight declines in several actions, though those looking to improve use of “warehouse technology and software” climbed 4% versus last year, and there was a slight (2%) increase in those looking to make layout or racking changes. Adding automation equipment to processes was cited by 19% this year, down from 22% last year.
Oddly, there was a 14% decline in improving inventory control as an action to address costs, even though in other parts of the survey, there is heightened interest in improving turns, and warehouse IT projects frequently include data collection procedures that improved inventory accuracy.
It could be that the respondent pool this year tended to be relatively confident in their overall inventory control process, but as Saenz points out, close attention to factors such as SKUs that are becoming obsolete, should be a constant focus, especially if an organization is tight on space.
“If anything, there should generally be more focus on inventory control,” says Saenz. “With all the supply chain disruption of the past two years, many organizations are facing inventory issues, and are focusing more on managing it, from understanding exactly where the inventory is and how much is available, what’s moving quickly and what isn’t so that they can get rid of obsolete or overly slow-moving inventory and make room for new inventory.”
When we asked about productivity metrics in use, 82% said they use some type of metric, down from 88% in 2021, and the lowest percentage we’ve seen for this question in the past four years. There was a fairly sharp (9%) drop in those using lines per hour as a metric, though tracking units per hour, orders per hour, and percentage of an engineered standard, all grew a bit.
We ask a separate question on metrics collected and used to manage operations, and found that 90% use some type of metric, down a bit from 94% last year. We asked about “perfect order metric” for the first time this year, with 41% indicating that they track this composite metric.
Global supply concerns
One of the more interesting parts of the survey examines the issues that pose the biggest challenge to DC operations. Over the last few years, the top pain point has been the inability to attract and retain a qualified hourly workforce. However, this year the leading pain point was new: “supply chain disruptions, particularly related to China.”
This supply chain disruption option garnered a 47% response, making it the leading issue we asked about. Next up was “insufficient” space, which shot to 45% this year from just 36% last year, followed in third by the inability to attract and retain enough hourly workers, which declined sharply from 59% to 39%.
It may be a case here of issue immediacy, with the supply disruption challenge being more in the here and now than the long-standing challenge of finding enough labor. Or, it may be that among this year’s respondents, the labor recruiting situation improved.
Materials handling systems in use
Source: Peerless Research Group (PRG)
However, labor recruiting and retention continues to be a major challenge for many companies. “Finding and retaining labor is still the No. 1 driving concern for everyone that we are working with,” says Saenz. “Labor availability remains a critical concern, and a key driver for automation.”
Another factor here may be that DC managers have so much on their plates—like running out of space, or receiving goods in unusual quantities, or meeting tighter e-commerce service levels—that the labor scarcity issue seemed less pressing to more respondents than it did last year.
Ultimately, there are many challenges to address in DC operations, and a more troubling macroeconomic picture than was the case a year ago. Some respondents will be adding automation and looking to leverage more IT, but there is no simple universal answer on what to do next.
As Saenz sums up: “I do think there is a massive refocusing on what to do next, given the current economic conditions, though in general for many companies, it still comes down to lowering labor costs and seeing if automation makes sense as a means of doing that.”

Article Topics
Warehouse News & Resources
The Ultimate WMS Checklist: Find the Perfect Fit 40th Annual Salary Survey: Salary and satisfaction up Data Capture: Bar coding’s new companions Salary Survey: Pay, satisfaction, youth on the rise Examining the impact of the Taiwan earthquake on global supply chain operations Reverse Logistics: Best Practices for Efficient Distribution Center Returns Exploring Customized Forklift Solutions More WarehouseLatest in Logistics
LM Podcast Series: Assessing the freight transportation and logistics markets with Tom Nightingale, AFS Logistics Investor expectations continue to influence supply chain decision-making The Next Big Steps in Supply Chain Digitalization Warehouse/DC Automation & Technology: Time to gain a competitive advantage The Ultimate WMS Checklist: Find the Perfect Fit Under-21 driver pilot program a bust with fleets as FMCSA seeks changes Diesel back over $4 a gallon; Mideast tensions, other worries cited More LogisticsAbout the Author
Subscribe to Logistics Management Magazine

Find out what the world's most innovative companies are doing to improve productivity in their plants and distribution centers.
Start your FREE subscription today.
April 2023 Logistics Management

Latest Resources


