Freight markets feel stuck in unseasonable doldrums with volumes low, capacity loose and rates in a trough after supply chain activity cooled post-COVID.
But as we know, the relationship of supply and demand is not static, but dynamic and ever-shifting. A pendulum moves slowest and briefly pauses just before it starts falling in the other direction. In the same way, freight markets can reach balance after a very slow, gradual move, and then start steadily accelerating in a new direction.
One of the perennial challenges for the transportation and logistics industry and the customers it serves is recognizing and responding to market shifts quickly. Retailers, manufacturers and suppliers that rely on their own freight bills to gauge the cycle are looking at a slice of the market that’s at least 60 days old. That lag causes the mistiming of freight bidding cycles, contract rates for awarded freight to quickly fall out of step with the market, service failures, disappointed customers, and ultimately lost sales and elevated chargebacks.
So how can we predict the next turn in the freight cycle? It depends on looking at the right data, understanding where it comes from in the freight cycle (and, if applicable, in the payment cycle), and distinguishing between leading and lagging indicators.
Let’s go back to the middle of 2020, a volatile melt-up in North American trucking that led to an unusually long upcycle. Even though the shippers were driving freight activity by replenishing inventory, increasing purchase orders and racking up sales growth that was in some cases astonishing, they were largely unaware of the effect their actions would have on the freight market. Truckload contract rates didn’t move meaningfully past 2019 rates until the last week of July and the first three weeks of August, when rates jumped from $2.06 per mile, excluding fuel, on July 26, to $2.20 per mile by Aug. 23.
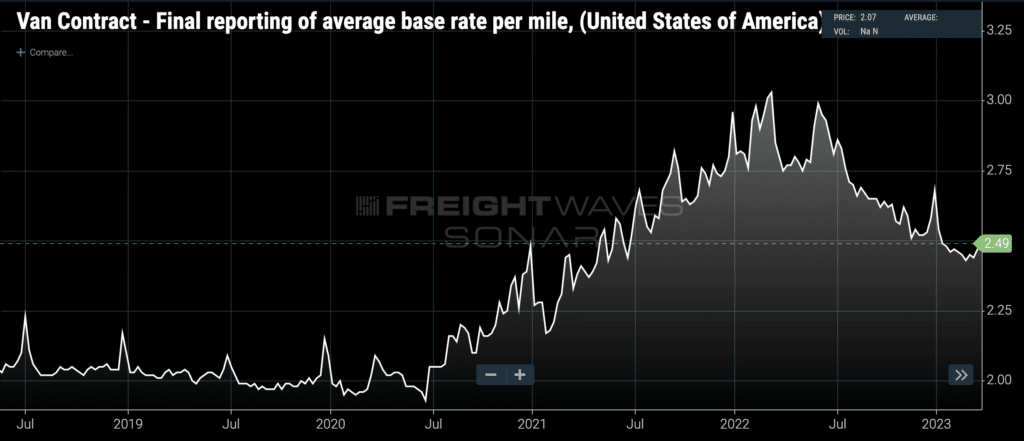
(National average dry van truckload contract rates. Chart: FreightWaves SONAR. To learn more about FreightWaves SONAR, click here.)
Shippers continued to pay up on their contracted freight as rates climbed to $2.48 by the end of the year. Then they made a classic error and tried to claw back some savings by resetting contract rates much lower for the beginning of 2021. By February, they were capitulating again, and by July 2021, contract rates were back up at $2.68, higher than before, and would go on to peak at $3.03 per mile in March 2022.
Here’s the thing — even though shippers first reacted to the changing market conditions in July/August of 2020 by raising contract rates, a massive capacity cycle was already baked into the data.
FreightWaves’ Outbound Tender Reject Index, which measures the percentage of truckload tenders rejected by carriers, had hit 8.4% on June 14 and was still on its way up, an unmistakable signal that spot rates would rise, too. On that day, FreightWaves’ National Truckload Index, a spot rate average built from the bookings of a 3PL consortium, stood at $2.14 per mile, inclusive of fuel.
By mid-August, the spot rate had jumped to $2.42, already 10% above contract rates. And by Dec. 27, when contract rates were still at $2.48, spot rates had climbed to $2.92 per mile.
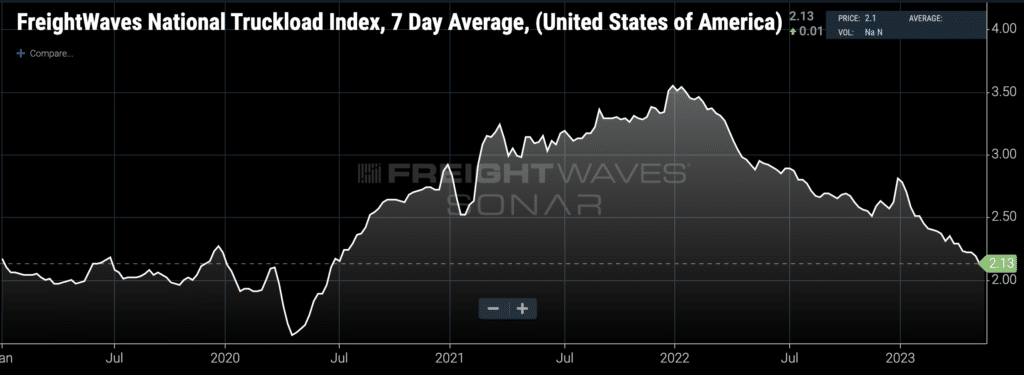
(National average truckload spot rates. Chart: FreightWaves SONAR. To learn more about FreightWaves SONAR, click here)
Throughout the entire upswing, shippers never recovered from their initial slow reaction and their mistaken attempt to reset contract rates lower in the first few months of 2021: Truckload service continued to deteriorate throughout the year, despite continual upward rate adjustments. Shippers couldn’t keep up.
So we’ve identified two key indicators that lead shippers’ contracted freight receipts. First, spot rates quoted on booking are a much more accurate reflection of the cost of moving a truck on any given day. Second, tender rejections rising past a key 7%-10% threshold always predict a similar move in the spot rate.
But FreightWaves data goes back even further up the supply chain, all the way to Asia. A large part of the high-velocity retail freight that responds immediately to consumer demand is imported from Asia, particularly China. That’s why transportation industry analysts study container imports — they’re full of freight that ends up on the rails and the highway, needing trucks and trains to move them to their final destinations.
Inbound container volumes at North America west coast ports in the summer of 2020 didn’t cross above 2019 until July. But the trip across the Pacific Ocean from China is a long one — can’t we do better? We can.
FreightWaves measures ocean container volumes at the time of booking when the shipper reserves the slot on the container ship, which is usually eight to 10 days prior to sailing. After departure, it can be 21 to 27 days across the ocean and five days dwelling at the destination container terminal before the box is cleared by customs and loaded onto a truck or train. That means the bookings can occur approximately 42 days before the volume is recorded as a “U.S. container import.”
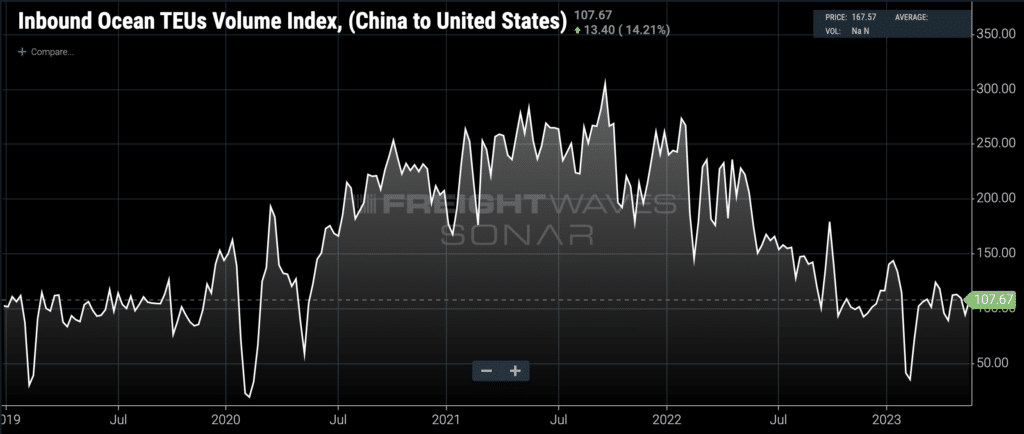
(Ocean container bookings inbound to the U.S. from China. Chart: FreightWaves SONAR. To learn more about FreightWaves SONAR, click here)
What China-to-U.S. container bookings reveal is that Chinese suppliers were already panicking and massively accelerating their shipping in December 2019 and January 2020. Bookings paused as the pandemic spread to other countries, travel bans were imposed, and new public health regimens were put in place, but they popped back up over pre-pandemic 2019 levels by March 9, 2020.
The early signs of a massive boom in freight, which meant tightening capacity, higher rates, elevated levels of congestion, stockouts and higher consumer spending, were already present before 2019 was over.
When it comes to predicting the next turn in the freight cycle, it’s obviously critical to watch the right data — leading pre-payment indicators built on bookings that happen well upstream of your own operations. What that looks like for you depends on your use case, including your industry vertical, role in the organization, the kinds of decisions the data is meant to support and your geographic network.
To schedule a consultation with FreightWaves about how our data can help you see the next cycle coming, click here.