In this edition of “SONAR Indices & Insights,” the SONAR team showcases several mileage-focused indices to aid carriers to build trucking KPIs that will inform decisions to optimize fleet utilization among other freight KPIs. These indices are in SONAR, the freight forecasting platform from FreightWaves.
This week, learn how asset-based and asset-lite carriers are monitoring mileage-based indices to improve profits and maximize utilization of both the driver workforce and trailers. In this article, carriers will learn about four SONAR indices to build trucking KPIs that show where to put the company’s focus to optimize fleet utilization:
Maintenance Expense per Mile (MAINT)
Miles per Truck per Week (MILTR)
Loaded Miles (%) (LOADM)
Empty Miles (%) (EMPTY)
What are the SONAR indices that aid in building trucking KPIs to optimize fleet utilization?
There are four available indices that allow carriers to build trucking KPIs to optimize fleet utilization. When a carrier can maximize assets such as trailer maintenance or decrease empty miles, profitability will increase. Let’s teach you what each index is and what trucking KPIs are built using the data within the freight indices.
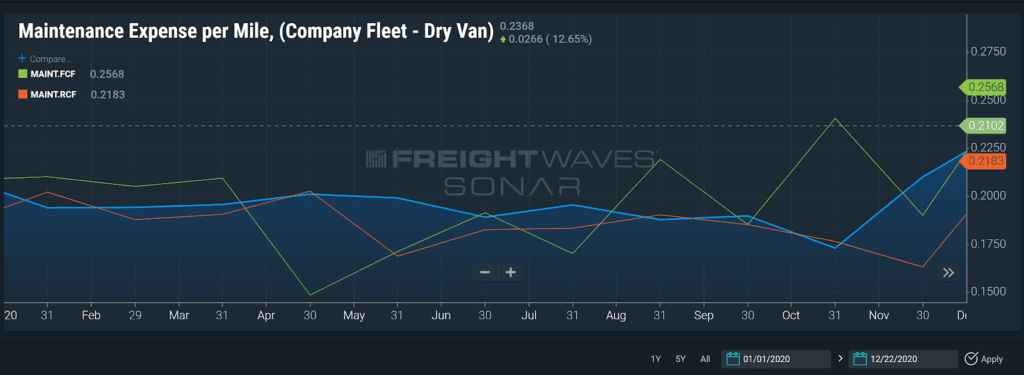
Maintenance Expense per Mile (MAINT)
The Maintenance Expense per Mile (MAINT) index captures the total maintenance expense, reported by participating carriers during a given month, expressed on a per-mile basis. The expense reported is specific to the maintenance of company-owned trucks, and company fleet-allocated trailers. Maintenance expenses include all internal (shop labor, parts, supplies and tools) and external (outside vendor parts, labor and supplies) expenses. The carriers reporting data for this index are participants in the Truckload Carriers Association’s TPP program.
Formula: maintenance expense / total miles.
The SONAR chart above shows the MAINT in the three equipment types: dry van, reefer and flatbed.
This index is highly dependent on the average tractor age of the reporting carriers, and the dominant operating mode utilized by those carriers. Several additional factors can influence the results for this index utilized to build your trucking KPIs. For example, the availability of qualified technicians determines whether or not common tractor and/or trailer repairs can be done with internal resources instead of external (outside vendors).
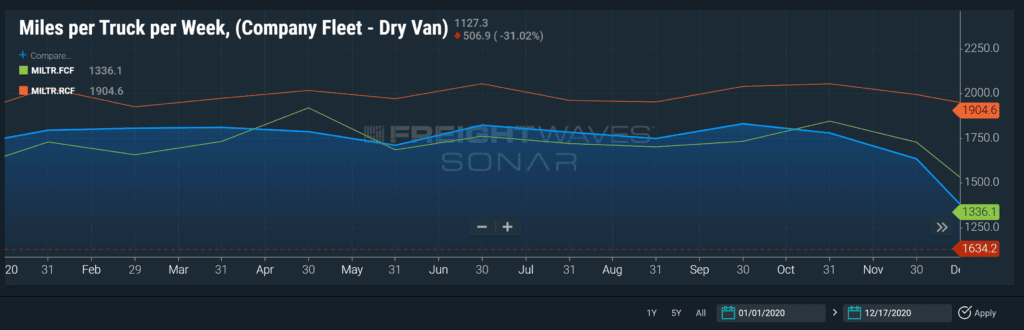
Miles per Truck per Week (MILTR)
The Miles per Truck per Week (MILTR) index displays the total number of miles traveled during the month, by tractors owned or contracted by the reporting carriers. Carriers reporting data for this index provide a truck count whether seated or unseated. If the truck is plated by the carrier, it is counted. As such, those with a high percentage of unseated tractors will be penalized in the form of a lower relative result. The carriers reporting the data for this index are also participants in the Truckload Carriers Association’s TPP program.
The Miles per Truck per Week formula is as follows: (total miles / truck count) / number of weeks in month.
The SONAR chart above shows the MILTR in the three equipment types: dry van, reefer and flatbed. Carriers may also see the MILTR on leased equipment only, or together with company-owned assets.
The MILTR index provides a measure of performance and health for the truckload segment. As carrier executives build their trucking KPIs, when this index shows higher results relative to historical values, it indicates a strong market. Conversely, lower measures indicate weaker economic activity. Since miles are the primary variable for determining carrier compensation, it is in the carrier’s best interest to maximize miles to enhance total compensation. This index is widely used by carriers as a trucking KPI.
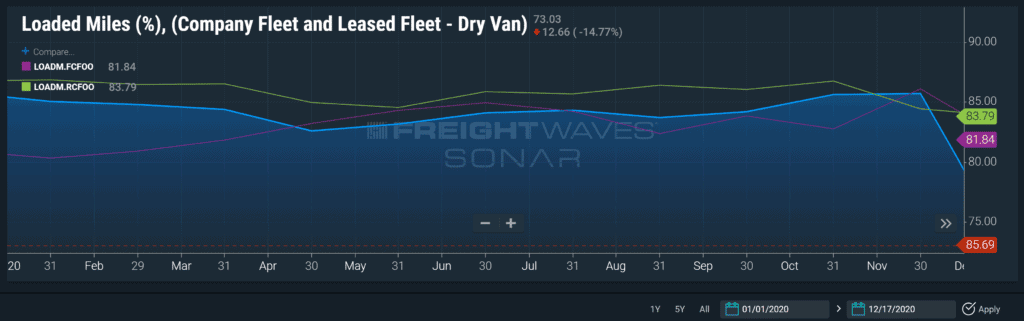
Loaded Miles (%) (LOADM)
The Loaded Miles (%) (LOADM) index expresses the number of loaded (billed) miles driven relative to the total number of miles driven during the month, expressed as a percentage. The carriers reporting the data for this index are also participants in the TPP program.
The formula for Loaded Miles (%) (LOADM) is as follows: (revenue miles / total miles) x 100.
The SONAR chart above shows the LOADM percentage in the three equipment types: dry van, reefer and flatbed. Carriers may also see the LOADM percentage on leased equipment only, or together with company-owned assets.
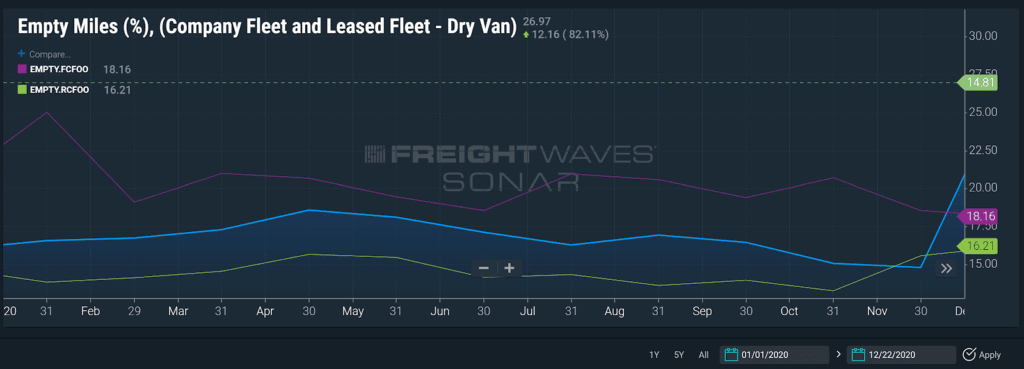
Empty Miles (%) (EMPTY)
The Empty Miles (%) (EMPTY) index expresses the number of empty (unbilled) miles driven relative to the total number of miles driven during the month, expressed as a percentage. The carriers reporting the data for this index are also participants in the TPP program.
The formula for EMPTY percentage is as follows: [(total miles – revenue miles ) / total miles ] X 100
The SONAR chart above shows the driver turnover percentage in the three equipment types: dry van, reefer and flatbed that are company-owned. Carriers may also see the turnover percentage on leased equipment only, or together with company-owned assets.
What LOADM and EMPTY tell carriers
In a robust freight market, carriers generally tend to reduce the geographical footprint of their freight network, and increase the utilization of their assets to reduce the number of miles travelled that are unbilled (to a shipper or shippers). Conversely, in a soft freight market, freight network footprints are expanded and the number of unbilled miles increases as well. Using the LOADM and EMPTY indices for your trucking KPIs will inform carriers of increased competition for backhaul freight, requiring carriers to generate a large number of unpaid miles to reach the origin of the backhaul freight.
Build smarter trucking KPIs by purchasing and using SONAR
In turbulent times, asset-based and asset-like carriers need certainty to stay ahead of the freight market and understand the impacts any current market is having on carrier operations. The premier freight forecasting engine, FreightWaves SONAR, allows carriers to benchmark, analyze, monitor and forecast improved fleet utilization.
SONAR ensures more proactive responses to the market, provides correlations between several indices to guide decisions and build smarter trucking KPIs. Click the button below to get a demo of SONAR to see what the platform can do for you.