

Leaders across the logistics industry have been making data-informed decisions for decades. Not all data is created equal, however, and many of the tools and processes that provided “cutting-edge” advantages several years ago have fallen behind the curve.
There is an innate lag in legacy data. This information, while valuable, only allows shippers to create probable forecasts based on historic norms. In an industry characterized by volatility, historical data does not always correlate to current or future conditions. In fact, one could argue that lagging data is only helpful in telling you what has already happened or when paired with other data sets more reliable at looking into the future.
Freight pricing is largely determined by the balance of supply and demand. Because of this, legacy signals do not provide the same advantages as understanding the direction of freight volume.
FreightWaves SONAR was created to solve the legacy data issue, providing a wealth of high-frequency, upstream data that comes together to provide predictive signals well before lagging indicators.
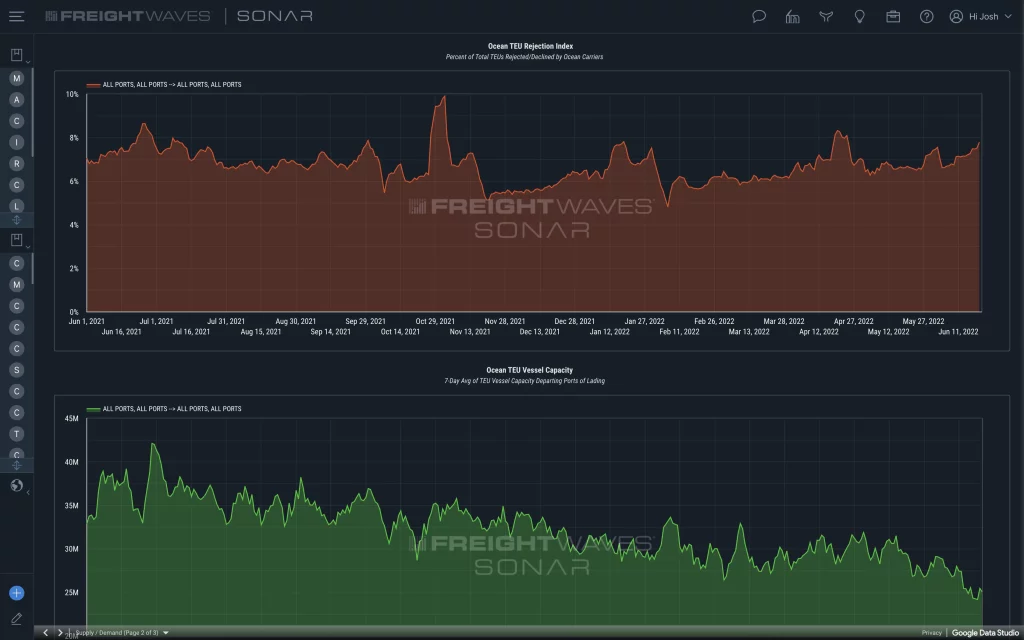
For example, tracking global container bookings at the port of origin allows more than 60 days of visibility into U.S. port activity.
FreightWaves predicted the future collapse of U.S. container imports in June 2022. This forecast was based on SONAR’s Container Atlas, which tracks global container bookings at the port of origin. In November 2022, container imports dropped to pre-pandemic levels, according to supply chain data company Descartes.
Container Atlas data provides shippers with a time advantage over U.S. import data because it accounts for container bookings at the time of reservation, not the time of arrival. The index then takes transit times and port delays into account, allowing it to predict future activity with unmatched accuracy.
This index can be consulted alongside other SONAR indexes — like the National Truckload Index (NTI) — to paint a vivid picture of current freight markets and overall economical health. FreightWaves NTI tracks the cost of moving dry van freight, providing a daily volume-weighted, all-in average of lane costs based on actual spot market transactions submitted by contributors of the FreightWaves Trusted Rate Assessment Consortium.
The NTI provides a transparent benchmark rate that, when paired with FreightWaves’ tender data, allows shippers to benchmark price and service simultaneously. Companies can leverage this data when negotiating long- and short-term pricing with carriers. It also gives managers the information they need to justify changes in operational expenses and forecast cost of goods sold.
SONAR data provides shippers with the ability to assess the industry — and the overall economy — on a macro level, providing critical insights for operational decision-making. These indexes, however, also prove invaluable to analysts covering transportation companies.
For example, analysts covering retailers or CPG companies need to include freight costs to estimate the cost of goods sold. Truckload rates built on payments data often lag and fail to show a clear picture of current market activity. This data can be weeks or months old. The NTI provides a daily reported spot rate to be used as a benchmark rate, based on shipment data not more than 24 hours old. Utilizing NTI as the benchmark rate reveals market fluctuations faster than lagging rate data that is stale by the time it is used in financial models.
The goal of Container Atlas and NTI — as well as several other SONAR indexes — is to offer transportation industry leaders a holistic view of real-time supply and demand. At the end of the day, this data can provide pricing and insights that legacy data simply cannot.
Want to know how you can use SONAR to optimize your freight movements?
Schedule a free consultation to see how SONAR can reduce your costs and performance risks.


