
Medium-term demand planning has always been a tough nut to crack for retailers, suppliers and manufacturers. Lack of data, lack of conviction and lack of organizational agility all conspire to keep companies from recognizing medium-term opportunities and challenges and responding decisively.
In this blog post, we’ll walk through some of the obstacles to medium-term demand planning, consider how high-frequency supply chain data can help fill the informational gaps that companies are grappling with, and then look at a real-world example of how the data in FreightWaves SONAR can give insight into the goods economy.
It’s hard to find good data that provides a view into the next few months of consumer behavior and economic activity. Short-term planning is much easier: Internal sales numbers and weekly survey or scan data tell us what immediate demand is doing, and it can be a relatively simple task to adjust freight flows up or down in response to those demand signals. Sometimes it’s just a matter of adding another shipment, or making shipment sizes larger in response to higher demand.
On the other hand, there are plenty of publicly available macroeconomic data sets to help with long-term demand planning — governments and banks publish GDP projections, the dot plot of Federal Reserve members helps investors understand whether monetary policymakers are feeling dovish or hawkish, and multiyear business cycles unfold in regular, if not entirely predictable, ways. Intrayear volatility tends to even out over a long enough period of time, so, paradoxically, long-term projections can often be more accurate than midterm projections.
It’s that duration in between short-term and long-term planning, what we can call ‘medium-term’ demand planning, that has proved one of the thorniest problems in demand forecasting. What will consumers do over the next several months or quarters?
Questions that involve midterm demand planning sound like: Will the back-to-school shopping season be bigger or smaller than last year? Will a delayed produce harvest in Florida and Southern California tighten refrigerated trucking capacity in midsummer? Will ports experiencing congestion remain clogged or will they clear up before peak season? Are the past few weeks of sales data an anomaly or part of a larger trend also experienced by competitors and other segments in the economy? How will I know if there’s an inflection in the economy or a change in behavior, and will I be able to build conviction fast enough to react in time?
Large enterprises like big-box retailers, CPG brands or major manufacturers often have trouble accelerating information flows in their own organizations to the point where they can respond quickly. Shippers who rely upon their internal data like freight bills paid to gauge the temperature of the freight market are looking at a slice of history at least as old as their billing cycle, and depending on the source of the data, potentially even older. And after a trend is spotted, the more confirmation a team requires to make a call, the longer the response will be delayed.
Therefore the art of medium-term demand planning is about quickly building conviction on fresh data and using it to drive decisive responses that can have an impact over the next 90 to 180 days and beyond.
Let’s look at a real-world example of how high-frequency supply chain data in the FreightWaves SONAR platform indicated that goods demand was sharply decelerating in the first quarter of 2022.
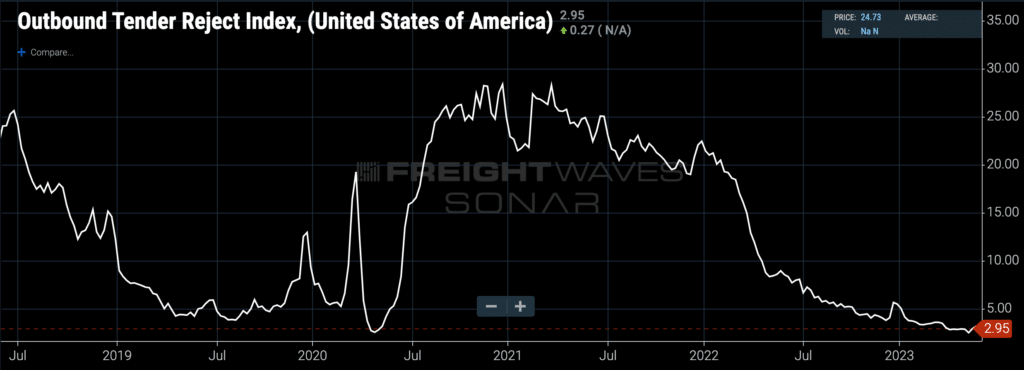
(The Outbound Tender Reject Index, or the percentage of loads rejected by carriers. Chart: FreightWaves SONAR. To learn more about FreightWaves SONAR, click here).
Heading into 2022, after a year of record consumer spending, sales growth and import volumes, shippers were looking for another strong year of outperformance. But supply-demand imbalances in the trucking spot market were emerging and warning that demand was turning negative.
The chart above displays the Outbound Tender Reject Index, the average percentage of truckload shipments tendered by shippers which were then rejected by their contracted carriers. At the end of 2020 and the beginning of 2021, the height of the pandemic’s “supply chain crisis,” trucking carriers were rejecting in excess of 25% of the shipments electronically tendered to them by shippers. A rejection rate that high indicated that trucking capacity was extraordinarily tight and strong upward pressure on spot rates would soon spike freight costs.
But look at the first quarter of 2022, particularly the month of March. On Feb. 27, 2022, tender rejections stood at 18.47%, well off their peak but still at a disastrously high level for any shipper trying to hold down transportation spend and avoid the spot market while moving freight off the docks. By April 24, rejections had been cut in half and then some, falling to 8.79% — still higher than shippers are comfortable with but a very clear signal that suddenly trucking carriers were worried that there wasn’t enough freight to go around. All of a sudden, carriers wanted their contracted freight and weren’t rejecting nearly as much of it.
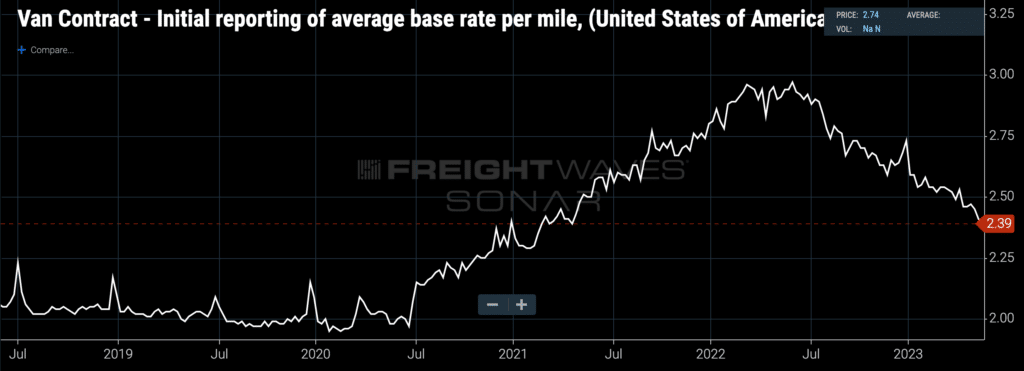
(Initial reports of van contract rates in USD per mile. Chart: FreightWaves SONAR. To learn more about FreightWaves SONAR, click here.)
But shippers didn’t realize this at the time, because their data wasn’t fast enough. Still believing in a fundamentally bullish thesis for the goods economy, they continued raising contract rates, which didn’t peak until June. They continued issuing purchase orders to their suppliers at an elevated level, and imports didn’t start coming down until June, either.
Shippers’ delayed reaction time to the sudden pullback in consumer spending — a pullback forced by a combination of less fiscal stimulus and higher inflation — contributed to the inventory glut that retailers are still trying to burn off a year later.
It’s clear now that a faster response time could have prevented a lot of the inventory overhang that now afflicts so many shippers — and a faster response time could have been achieved with faster supply chain data propagated through shipper organizations. In particular, daily tender rejection data, which measures trucking market activity of the prior 24 hours, clearly showed softening demand and a new willingness on the part of carriers to service their contracted freight.
Shippers who incorporated tender rejection data into their demand forecasting models knew that much of the goods economy was coming under pressure from macroeconomic externalities and that fewer goods would be needed to meet demand in the medium-term future.
To schedule a conversation with a SONAR expert about how to use high-frequency supply chain data in your demand planning exercises, click here.