

As we’ve been doing every Monday, the SONAR team teaches you about another index (or two) found within SONAR, the freight forecasting platform from FreightWaves. This week, learn how freight market participants monitor intermodal shipping activity with two indices: the RAIL index, to measure intermodal volumes; and INTRM, to monitor domestic intermodal spot rates. In this article, you learn what both the RAIL and INTRM indices are, what the RAIL and INTRM indices tell freight market participants, who in the freight market relies on these indices and what is the value to each participant. In addition, there is a freight market expert’s deeper insight into the intermodal shipping segment using the INTRM index as well as other SONAR indices to provide deeper insights around what changes in these intermodal-centric mean to freight market participants.
The RAIL index found in FreightWaves SONAR is a daily series of the average containerized intermodal volume from the prior seven days in two markets, domestic and international, which are noted by the addition of either “O” for domestic (ORAIL) and “I” for international (IRAIL) to monitor volumes in either markets.
For example, if there were 700 intermodal shipping containers moved between City A and City B in the past week, that lane shows a total ORAIL value of 100. Containers are counted at the time they enter the originating rail terminal, or are ingated, rather than when they are moved by the railroad, to make the series more forward-looking. The volume can be viewed in detailed granularity, as described below.
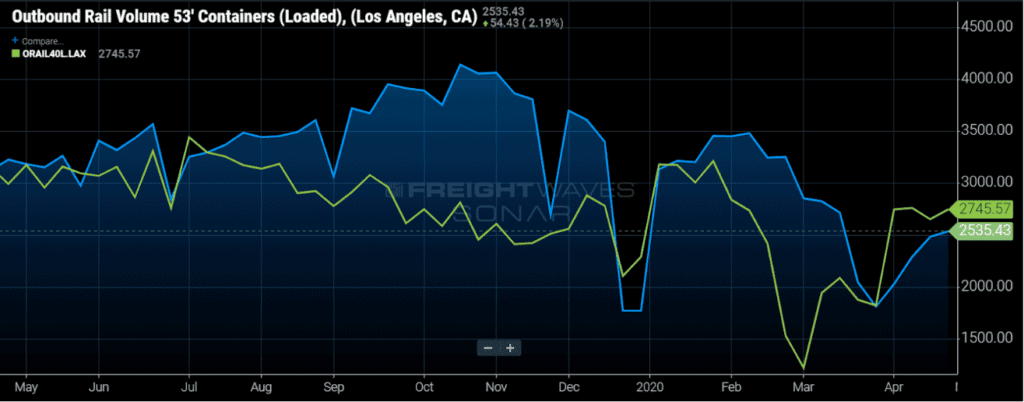
In the chart above, you can see the 40’ and 53’ container volume out of L.A. from May 2019 to May 2020.
ORAIL/IRAIL is the ultimate intermodal shipping volume tool. It gives SONAR users visibility to daily changes in the intermodal market and is broken down in detailed granularity not found in other data sources.
According to the Association of American Railroads (AAR), rail intermodal is the largest single source of U.S. freight rail revenue and represents a competitively priced, environmentally friendly alternative to road transport. It has grown in large part because railroads have invested billions of dollars on new intermodal terminals, track upgrades, and other infrastructure projects that have made rail intermodal more reliable and cost-effective.
Rail intermodal is defined as the long-haul movement of shipping containers and truck trailers by rail, combined with a truck or water movement at one or both ends. Intermodal allows railroads, ocean carriers, trucking companies, and intermodal customers to take advantage of the best attributes of various transportation modes to yield an efficient and cost-effective overall freight movement.
The daily volume of intermodal shipping containers tells you:
Because domestic intermodal and international intermodal shipping are two distinct markets, ORAIL/IRAIL can be broken down between international (ORAILINT) and domestic (ORAILDOM), and can be further broken down by container size. For example, If one wants to look only at the volume of 53’ domestic containers and exclude all other sizes, use ORAIL53. For only the volume of 20’ international containers, use ORAIL20.
In addition, ORAIL and IRAIL are also broken down between loaded container volume (ORAILL) and empty container volume (ORAILE). We recommend utilizing that breakdown because of the differing economics between carriers moving loaded containers and revenue empties. For example, the volume of 40’ loaded container movements is ORAIL40L while the volume of empty 40’ container movements is ORAIL40E.
ORAIL and IRAIL are broken down by inbound and outbound volume origin/destination market and are also broken down by lane. That’s important since intermodal shipping volume is dominated by a few key lanes.
Use airport codes to utilize granularities. For example, for 53’ loaded containers between Los Angeles and Chicago use ORAIL53L.LAXCHI. For 40’ empty containers arriving into Seattle from all origins use IRAIL40E.SEA.
The Intermodal 53’ Container Spot Rates (INTRM) index displays the weekly average door-to-door intermodal spot rates for 53’ containerized movements.
The intermodal freight rates are presented on a per-mile basis, and SONAR users can see the weekly average for all origin-destination pairs (INTRM.USA) or for specific lanes, such as Los Angeles to Chicago (INTRM.LAXCHI).
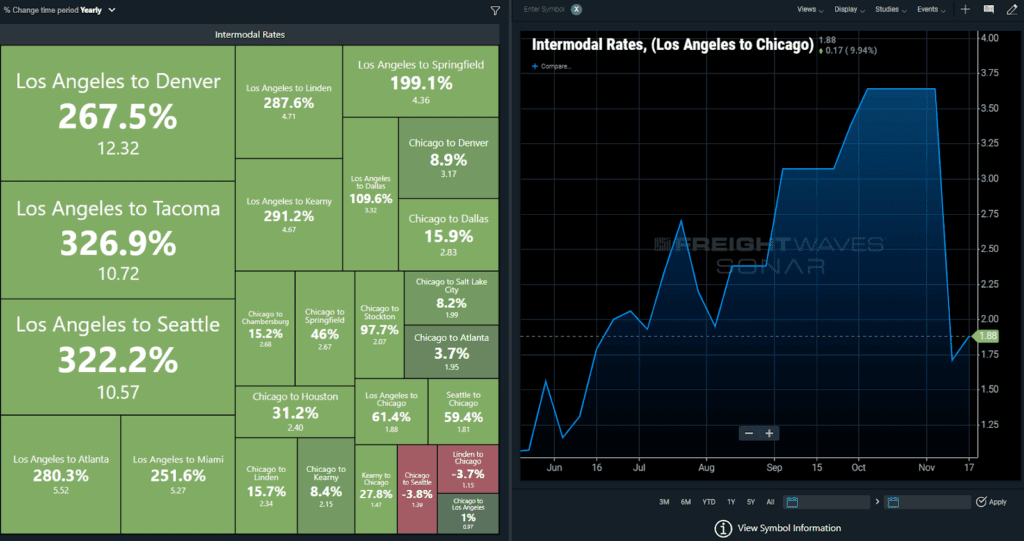
Intermodal Rates TreeMap feature (Y/Y % Change)
In the TreeMap above, SONAR users can view average intermodal spot rates for 53’ containers on major intermodal lanes compared to this time last year.
Using INTRM, you are able to see intermodal shipping spot freight rates to move 53’ domestic containers, presented as a weekly average.
In addition to viewing the domestic intermodal spot rate for the U.S. market as a whole (INTRM.USA), intermodal spot rates can be seen on individual lanes such as L.A. to Chicago (INTRM.LAXCHI), New York/New Jersey to Chicago (INTRM.LINCHI), and Chicago to Atlanta (INTRM.CHIATL).
You can view this data as a change over the past week (INTRMW), fortnight (INTRMF), month (INTRMM), quarter (INTRMQ), or year (INTRMY). For example, to see the year-over-year change in the domestic intermodal spot rate between L.A. and Dallas, use the ticker INTRMY.LAXDAL.
The various freight market participants can use INTRM to monitor intermodal shipping spot rates domestically in the following ways:
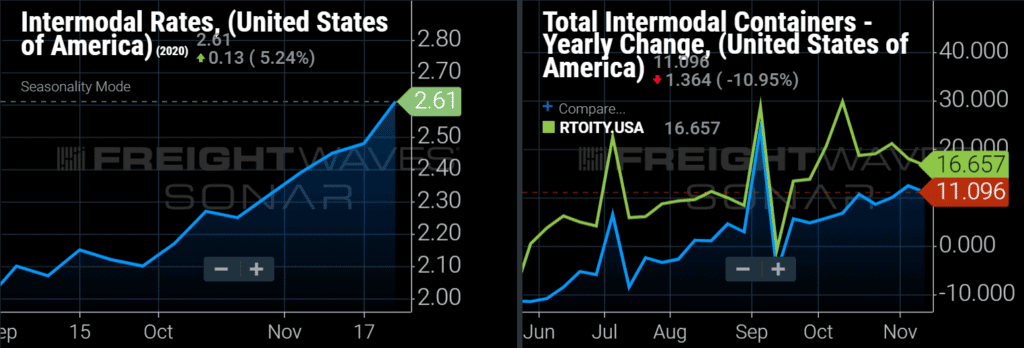
With tender rejection rates hitting new highs and with one month remaining during peak season for trucking, look for intermodal volume and intermodal spot rates to remain elevated. Highlighting the impact that the tight trucking market is having on intermodal, intermodal containers (RTOICY.USA) and trailer volume (RTOITY.USA) increased 11.1% year-over-year (y/y) and 16.7% y/y, respectively, in the most recent week.
In addition, the SONAR nationwide intermodal shipping spot rate (INTRM.USA), calculated as a weighted-average of door-to-door spot rates to move 53’ containers as quoted by the Class I railroads, reached a new all-time high at $2.61, up from $2.48 the previous week and up 77% y/y. Those data points indicate that shippers may be unable to utilize intermodal as a relief valve to a tight truck market given capacity constraints in intermodal as well.
In uncertain times, freight market participants need certainty to stay ahead of the freight market and understand the freight demand occurring in each participant’s most important lanes, markets and shipping modes. The premier freight forecasting engine, FreightWaves SONAR, allows participants to benchmark, analyze, monitor and forecast freight demand and costs. SONAR ensures more proactive responses to the market, provides correlations between several indices to guide decisions, and the ability to manage freight budgets or margins more proactively. Get a demo of SONAR to see what the platform can do for you.

