Today’s transportation industry leaders are aware of the importance of staying up to date on market movements. While the logistics space has long been characterized by volatility, the years during and immediately following the pandemic have proven particularly chaotic.
This quick-shifting environment has inspired an upswing in brokers, shippers and carriers seeking to better understand not only what the market is doing today but also what the market will be doing tomorrow.
The best way for people to gain the level of insight they crave is through high-frequency data, particularly insights into spot rate trends.
Why should I track spot rates?
Understanding truckload spot rates is critical to understanding the transportation markets as a whole. Logistics industry conditions are inextricably linked to supply and demand trends in the overall economy, and spot rates are typically the first place those impacts become visible. When demand for goods increases, so do spot rates. When demand for goods decreases, spot rates follow suit.
In addition to signaling market shifts, spot rates show seasonal trends over the course of a year. By analyzing spot rate movement, industry leaders can gain a better understanding of broader economic changes. Slower changes to longer running trends are more indicative of supply-side conditions, whereas demand shifts tend to move the index sharply.
By tracking spot rates in real time — and analyzing rate trends over recent periods of time — shippers, brokers and carriers can get a clear picture of how the market is behaving today and more accurately predict how it may react in the future.
Being able to predict what the transportation markets — and the economy as a whole — will do next gives companies across the industry the ability to plan ahead, optimizing their businesses for upcoming conditions and safeguarding their bottom lines.
How can I track spot rates?
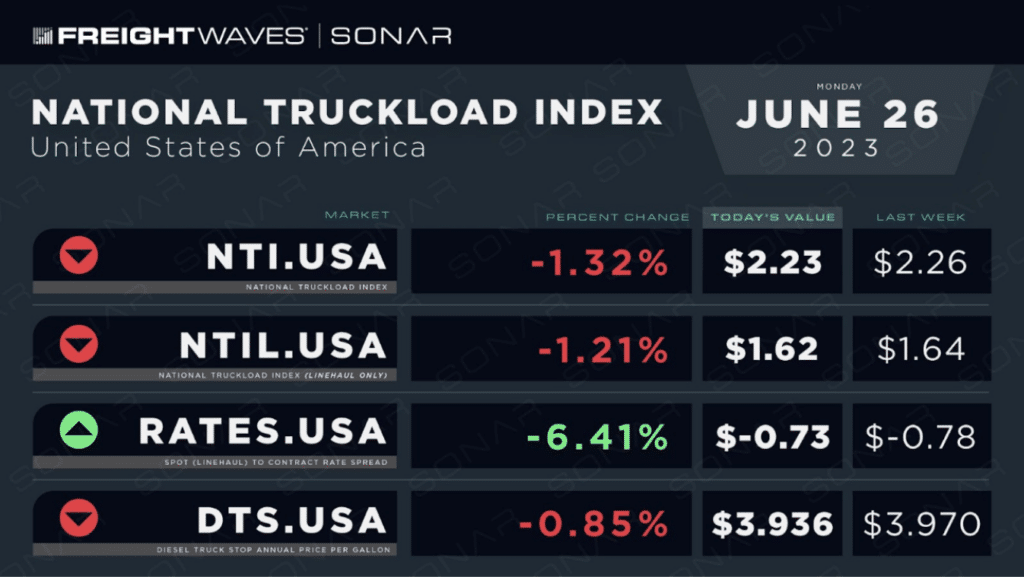
SONAR’s National Truck Index (NTI) illustrates spot rates based on an average of booked dry van loads from 250,000 lanes across the nation on a daily or weekly basis. The index also informs a 30-day dry van spot forecast (NTIF) that is updated each day.
The daily transactions that fuel NTI insights come from the FreightWaves Trusted Rate Assessment Consortium (TRAC). The values include fuel and exclude loads moving less than 250 miles, which helps ensure rates are representative of the overall market in real time.
Dry van spot rates are used to track trends and averages because they are the most representative of all regions and lanes, with 70% of truckload movements across the country being classified as dry van.
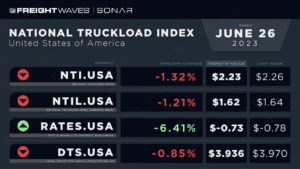
Several SONAR tickers provide different views of the NTI, allowing individual users to get insights they need to navigate their unique needs.
Available NTI tickers include:
- NTI.USA – seven-day moving average.
- NTID.USA – daily average.
- NTIB.USA – daily business day average.
- NTIL.USA – seven-day moving average of the daily spot rate less the estimated cost of fuel.
- NTIBL – daily business day average less the estimated cost of fuel.
- NTIF – 30-day forecast of NTI looking out from today.
- NTIF7 – seven-day forecast history for NTI.
- NTIF14 – 14-day forecast history for NTI.
- NTIF28 – 28-day forecast history for NTI
Interested in learning more about how NTI and other forward-looking SONAR indexes can help you plan ahead? Click here to schedule a demo.


