


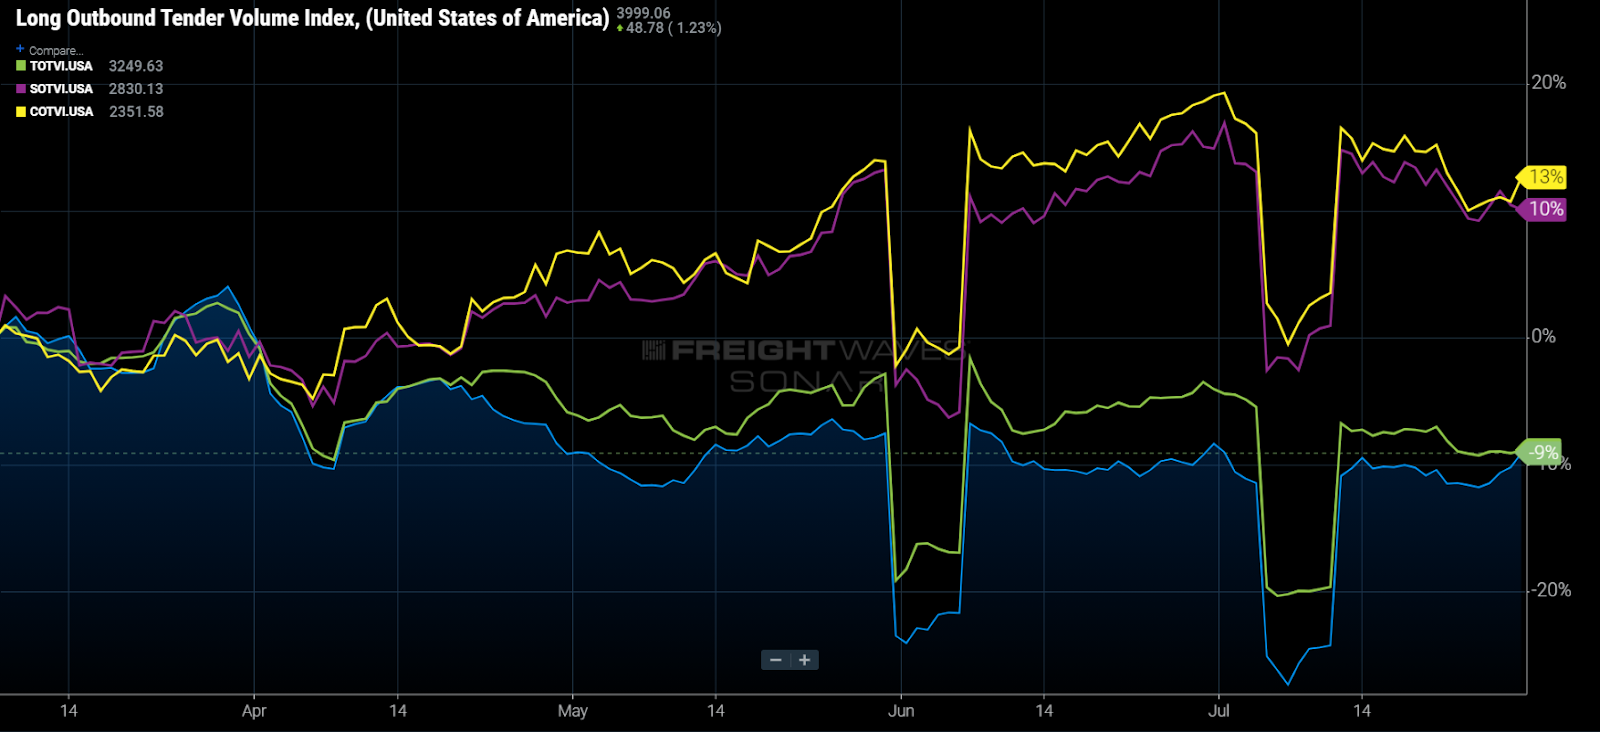
Chart of the Week: Long Haul Outbound Tender Volume Index, Tweener Outbound Tender Volume Index, Short Haul Outbound Tender Volume Index, Local Outbound Tender Volume Index – USA SONAR: LOTVI.USA, TOTVI.USA, SOTVI.USA, COTVI.USA
Total load tender volumes (shippers’ electronic requests for capacity) have not changed much since March — falling only 1.8% — but their rate of rejection has fallen from 28% to 21% in the same time period. In other words, more loads are being accepted at previously agreed upon rates while demand remains flat. Does this mean capacity has increased? Not necessarily.
Contracted rate increases are more than likely playing a big role, but there is a less obvious factor that is probably contributing to the increasing compliance — an acceleration of growth in loads that travel less than 250 miles from the origin with a decline in 800 mile-plus loads.
An increase in contract rates is playing an obvious role, but shippers are moving an increasing amount of short-haul freight this summer. Tenders for loads moving less than 250 miles have grown 11% since early March, while requests for loads moving more than 450 miles have contracted nearly 10%.
The chart shows the national outbound tender volume index (OTVI) broken into load tenders for shipments moving at various lengths of haul in percent change from March 8:
- Long haul (LOTVI) — loads moving over 800 miles.
- Tweener (TOTVI) — loads moving between 450 and 800 miles.
- Short haul (SOTVI) — loads moving between 100 and 250 miles.
- Local (COTVI) — loads moving less than 100 miles.
Starting near the beginning of the second quarter, there was a notable shift in the types of loads shippers were tendering. So why would this assist with increasing compliance rates?
Loads that move within a day’s travel do not have as large of an impact on capacity as loads that move more than a day away — roughly 500 miles. Drivers theoretically should be able to drive back to the origin within a 24-hour period on loads that move less than 250 miles, keeping capacity in the same market.
This matters more so in markets that have a significant portion of the nation’s outbound load demand like Atlanta and Los Angeles. These two markets have had very different experiences this summer, however.
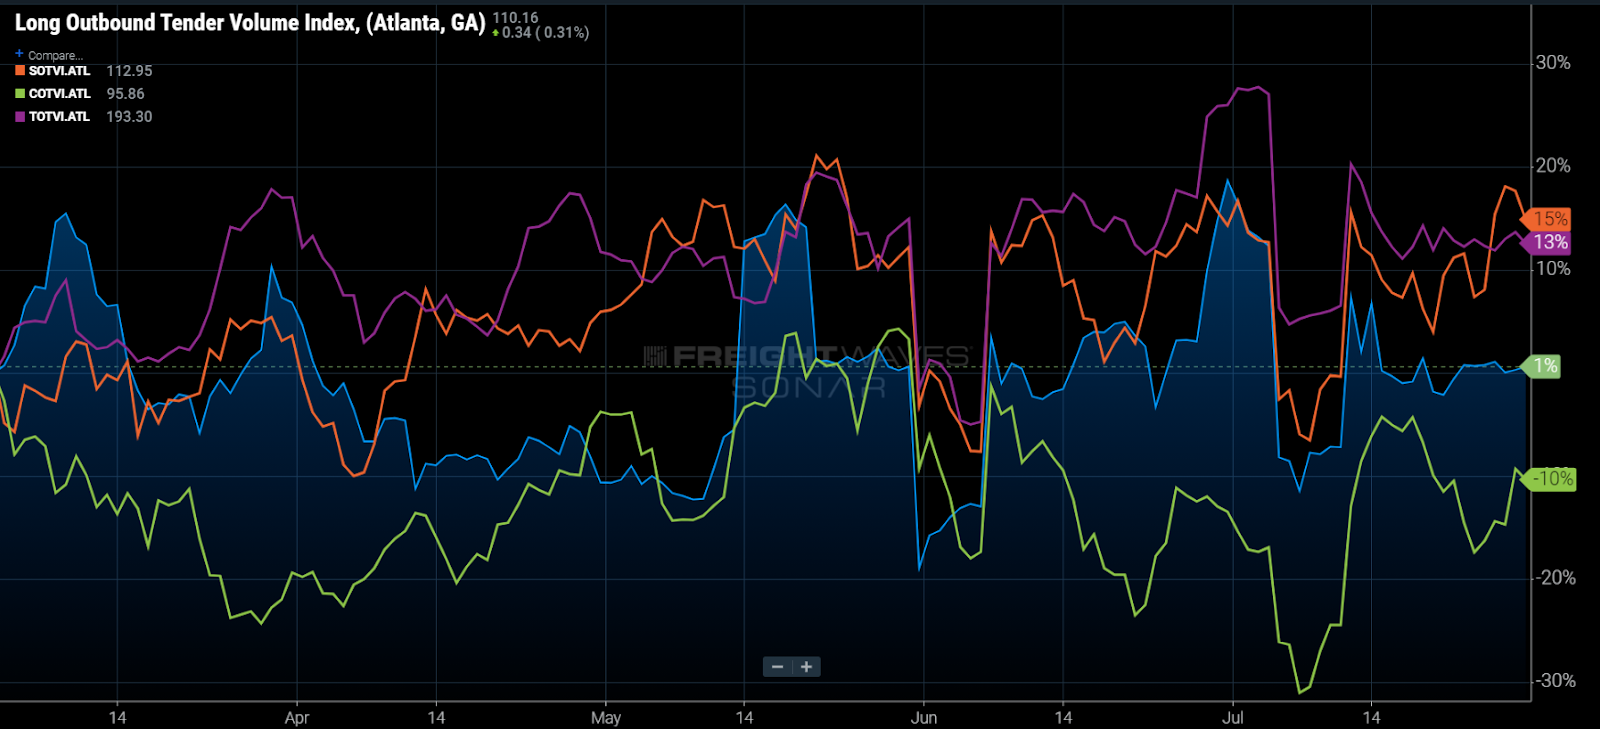
Looking at a chart of the same data for Atlanta shows mixed results. Tweener and short haul have grown similarly, while long haul has been sporadic with local freight demand contracting. Considering the Atlanta market hit an all-time high rejection rate of 31% at the end of June, this makes sense.
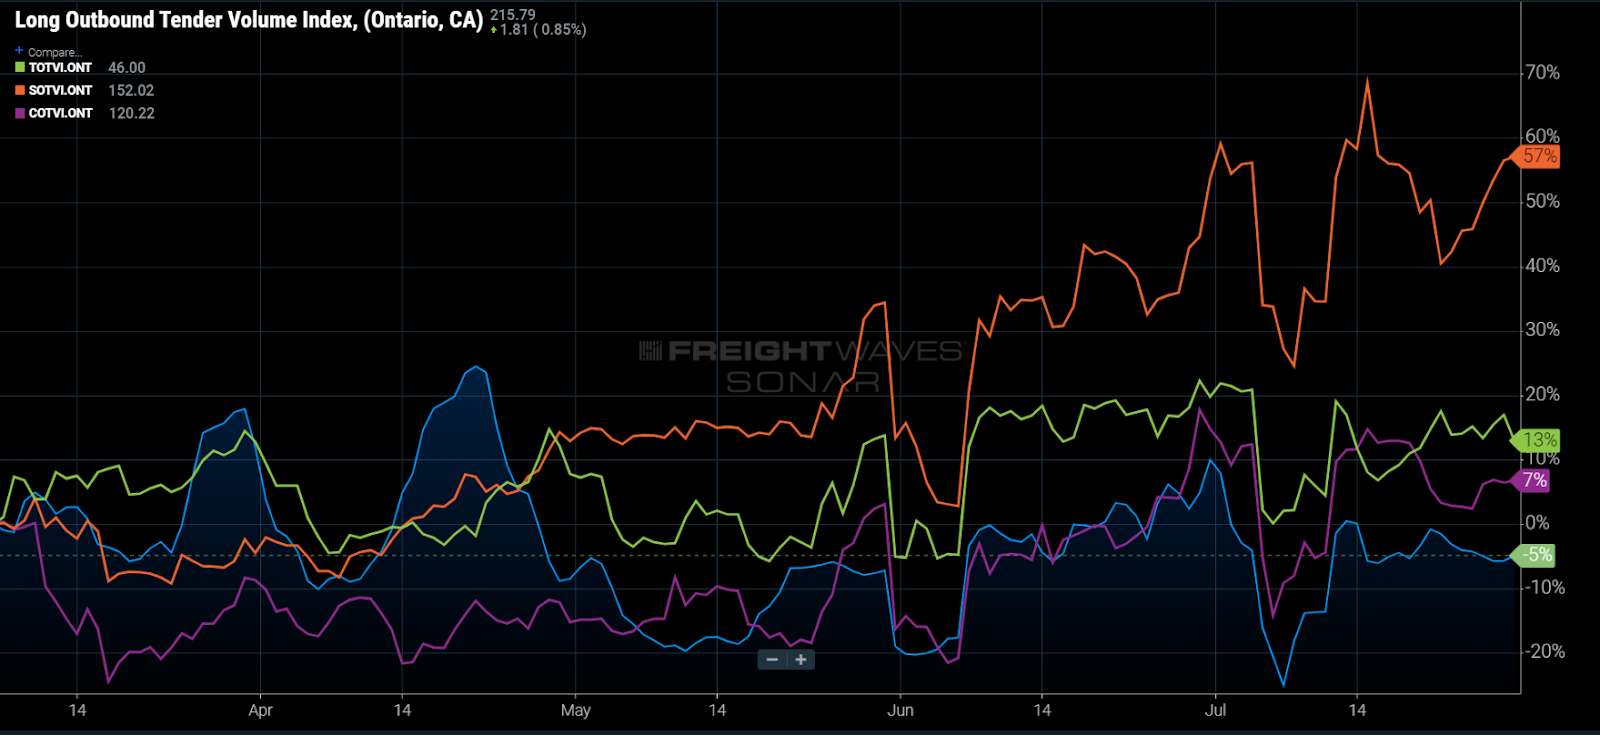
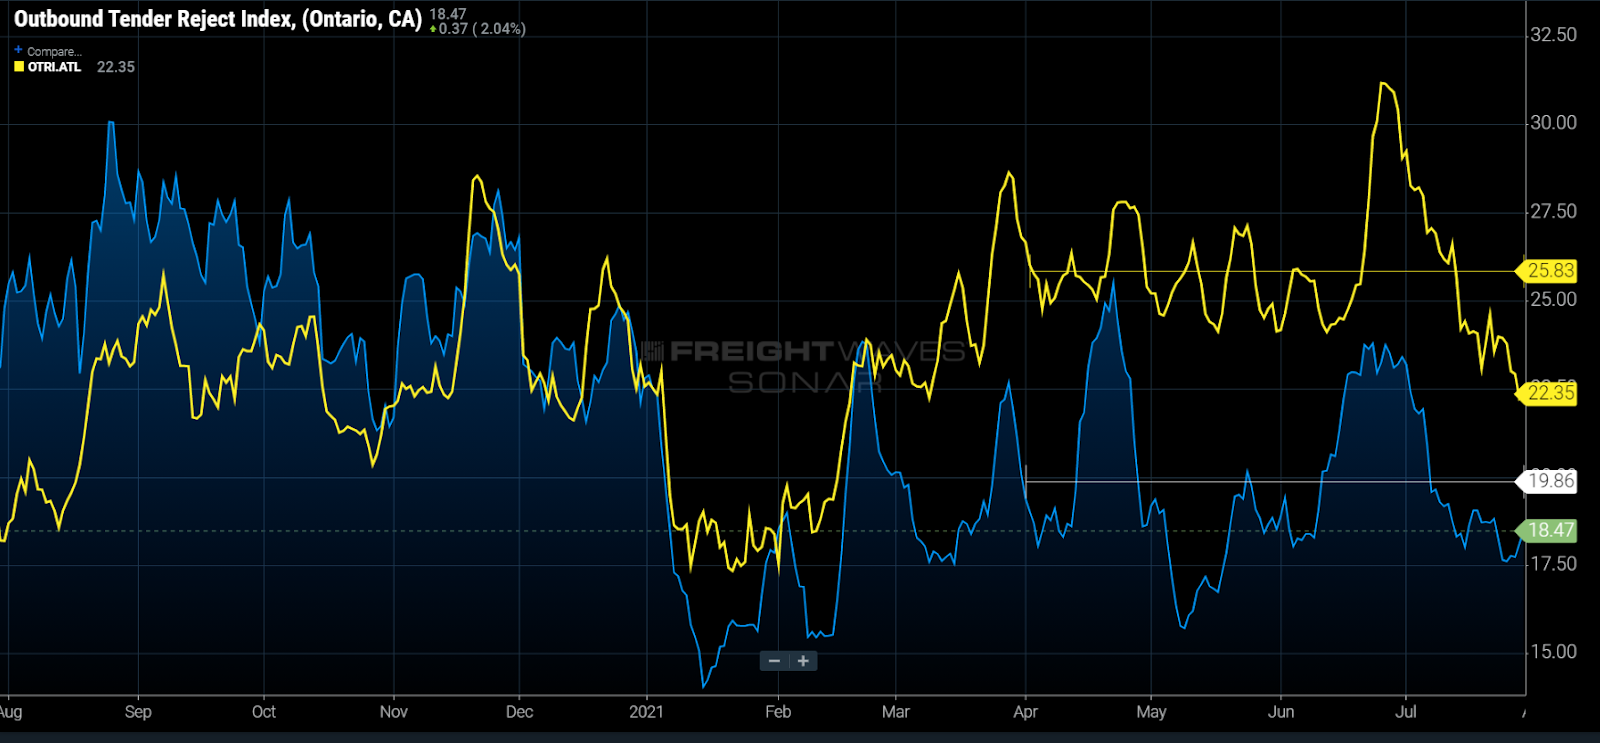
Looking at the tender volumes for Ontario, California, short-haul volumes have grown 57%, while long-haul volume has contracted by 5% since the first week of March. The outbound tender rejection rate (OTRI) for the market averaged 19.9% from April through July compared to 25.8% for Atlanta.
This is not to prove that shorter lengths of haul are the main reason for elevated contract compliance, but they are definitely a contributing factor as demand remains elevated beyond the available trucking capacity level in the U.S.
About the Chart of the Week
The FreightWaves Chart of the Week is a chart selection from SONAR that provides an interesting data point to describe the state of the freight markets. A chart is chosen from thousands of potential charts on SONAR to help participants visualize the freight market in real time. Each week a Market Expert will post a chart, along with commentary, live on the front page. After that, the Chart of the Week will be archived on FreightWaves.com for future reference.
SONAR aggregates data from hundreds of sources, presenting the data in charts and maps and providing commentary on what freight market experts want to know about the industry in real time.
The FreightWaves data science and product teams are releasing new data sets each week and enhancing the client experience.
To request a SONAR demo, click here.

Anna
I am now making more than 350 dollars per day by working online from home without investing any money.
Join this link posting job now and start earning without investing or selling anything.
visit here………… www.jobs70.com