
Third-party supply chain and freight market data has become an important tool for retailers, manufacturers and suppliers who want to redesign their networks, improve strategic planning, benchmark their transportation spend and the service they’re getting in return, and measure the efficiency of their facilities.
Leading supply chain organizations are using data on freight rates, volumes, capacity and shipment visibility to empower their teams to conduct complex analytics projects and build automated decision support systems.
These supply chain teams often run into a dilemma, though: Some data sets are relatively bare, presenting just a few data points with little context. That data often requires human intervention to review and interpret before it can usefully inform the decision-making process. For instance, a shipper who moves frozen, food-grade shipments may want to use an average temperature-controlled truckload spot rate, but will find that manual adjustments are required to translate from “reefer” to “frozen,” a subset of the broader category. Similarly, drop-and-hook shipments are priced differently than live load-live unload shipments, and knowing whether capacity on a lane is tightening or loosening may be more useful than an average rate for a big-box retailer that is buying capacity well below market.
Context matters
FreightWaves has found through integrations, partnerships and conversations with customers that rich, high-quality data sets with multiple data points and contextualizing attributes are better for supporting automation. Simply put, transportation managers who consume a bare national average truckload spot rate or a rate for a certain lane will still have to make adjustments up or down based on the direction the market is headed and the characteristics of the load in question before they are ready to transact.
A $2-per-mile spot rate from Chicago to Atlanta means one thing if the market is heating up but something else if spot rates are on their way down. Shippers and transportation providers need humans to interpret that rate, building in buffers or making adjustments, before it can be relied upon to do business.
But by including multiple data points — like capacity trends, confidence scores, ranges and multiple years of data to analyze seasonality effects — supply chain organizations can give their algorithms more context to help their systems know what to do with the inputs coming in.
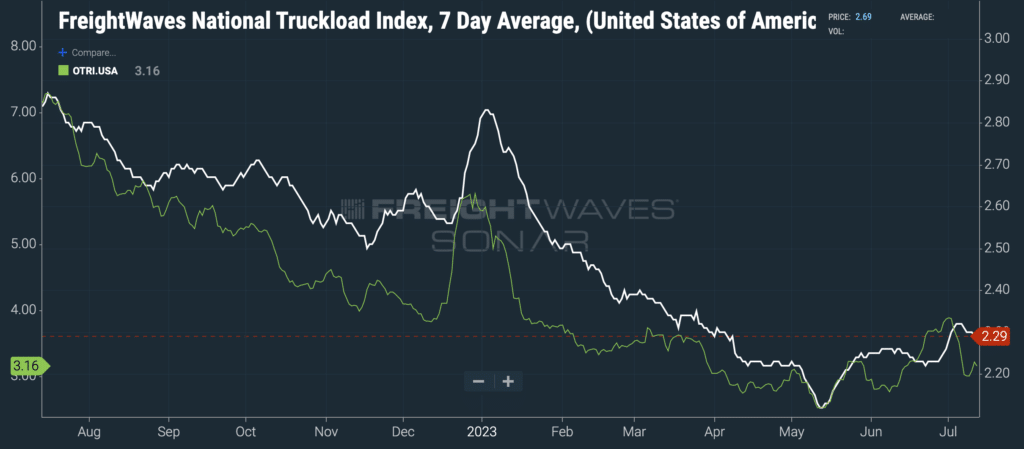
(FreightWaves’ National Truckload Index, a truckload spot rate inclusive of fuel in USD per mile, in white [right y-axis] and the Outbound Tender Reject Index, the percentage of tendered truckload shipments rejected by carriers, in green [left y-axis]. Chart: FreightWaves SONAR)
Here’s an example: A transportation manager notices that the spot quotes being returned by a 3PL are coming in higher and higher, exceeding market rates. Without any other context, the transportation manager has to investigate market conditions, compare quotes from other providers and look at historical spend data to understand if the market is moving outside the rates defined by the routing guide. But if the transportation manager has access to more data — tender rejection rates, for instance — then these decisions can be automated. Simple rules can be constructed so that if a quote is returned above market and rejections are above 8%, then the shipment is tendered, but if a quote is returned above market and rejections are below 8%, a human approves the tender or the load is tendered to a secondary provider.
When the logistics software platform Hubtek integrated FreightWaves SONAR data, it combined SONAR’s TRAC spot rates with confidence scores. In cases where market conditions on a given lane were shifting rapidly and the rate was returned with a “low confidence,” Hubtek provides a range for the price of a truckload shipment rather than defining an exact rate.
Here’s a good rule of thumb: The sparser a data set is in terms of column headers, attributes and accompanying values, the more human expertise and ingenuity will be required to ingest, interpret and use it correctly. On the other hand, the richer the data, the more that automated systems and algorithmically powered decision engines can do with it in the confidence that things won’t go wildly off track.
Leading supply chain teams are busy investing in technology and automation to improve their organizations’ efficiency and responsiveness. They want to automate routine tasks and simple decisions and let their people concentrate on exception management, relationships and strategic initiatives. They’re finding that comprehensive supply chain data platforms like FreightWaves SONAR have the depth and breadth to support those automated decision layers and give their systems the information needed to arrive at the best decision instantly.
To learn more about FreightWaves SONAR, click here.