Achieving Supply Chain Sustainability Success
The journey toward greener supply is not without its challenges. The path forward may seem unclear, complex, and even insurmountable at times, but even the
Just as freight industry news hinted at a market rebound and an uptick in global supply chain performance, the bridge catastrophe in Baltimore sent ripples across transportation networks. As a result, maintaining end-to-end shipment visibility and quickly adapting your transportation strategy is integral to controlling costs in Q2.
Economic impacts are still emerging following the closure of the Port of Baltimore, the nation’s top destination for roll-on/roll-off cargo. Locally, the closure will likely affect freight transportation costs and service as 4,900 trucks using the Francis Scott Key Bridge daily will face diversions, congestion, and longer travel distances.
At the same time, annual import arrivals of $23 billion in autos & light trucks and $5 billion in construction machinery, as well as agricultural implements, iron & steel, and other material handling equipment will divert to other East Coast ports. Expect cost and travel times to increase and demand to shift into new markets and modes. At the same time, additional supply chain pressures loom due to ongoing conditions in the Panama and Suez canals, labor negotiations at U.S. South Atlantic and Gulf Coast ports, and drought threats for Mississippi River bottlenecks.
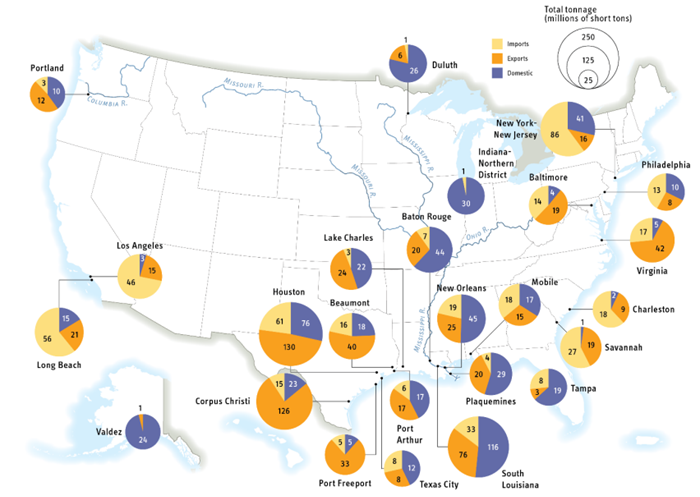
Source: U.S. Department of Transportation Bureau of Transportation Statistics, based on 2021 data (latest available) provided by U.S. Army Corps of Engineers, Waterborne Commerce Statistics Center. Special tabulation as of November 2023.
These shipping disruptions occur as the nation’s 10 largest ports recorded a 25.3% increase in inbound freight volumes during February, the fifth consecutive increase after months of decreases. Likewise, ocean shipping lines expected an early peak season with more goods moving in June and August following ongoing global inventory depletion.
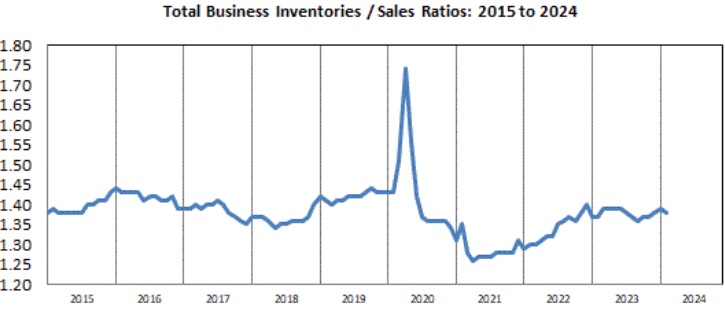
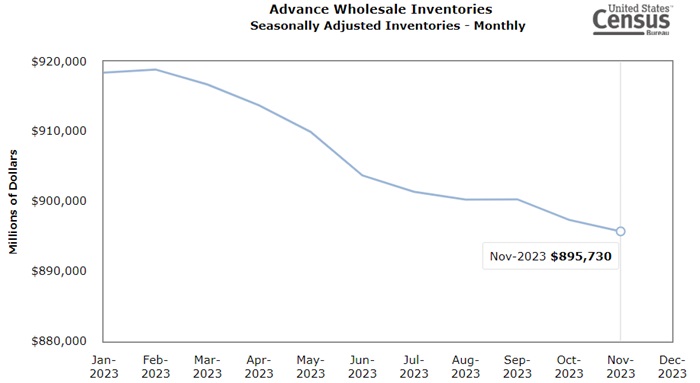
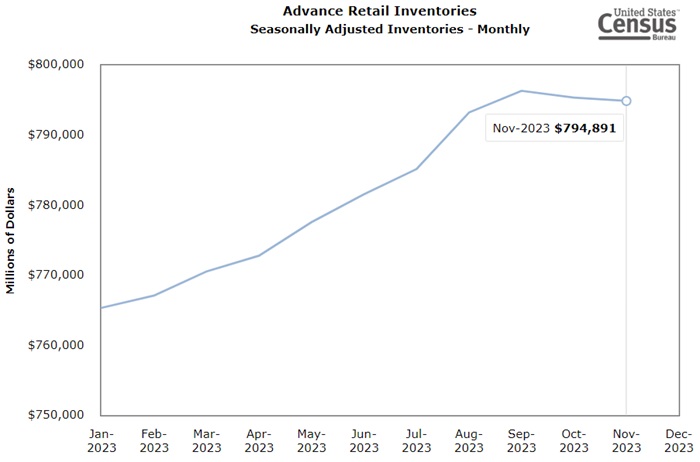
U.S. total business end-of-month inventories for February 2024 were $2.567 trillion, up 0.4% from January. U.S. total business sales were up 1.6% to $1.866 trillion from the prior month.
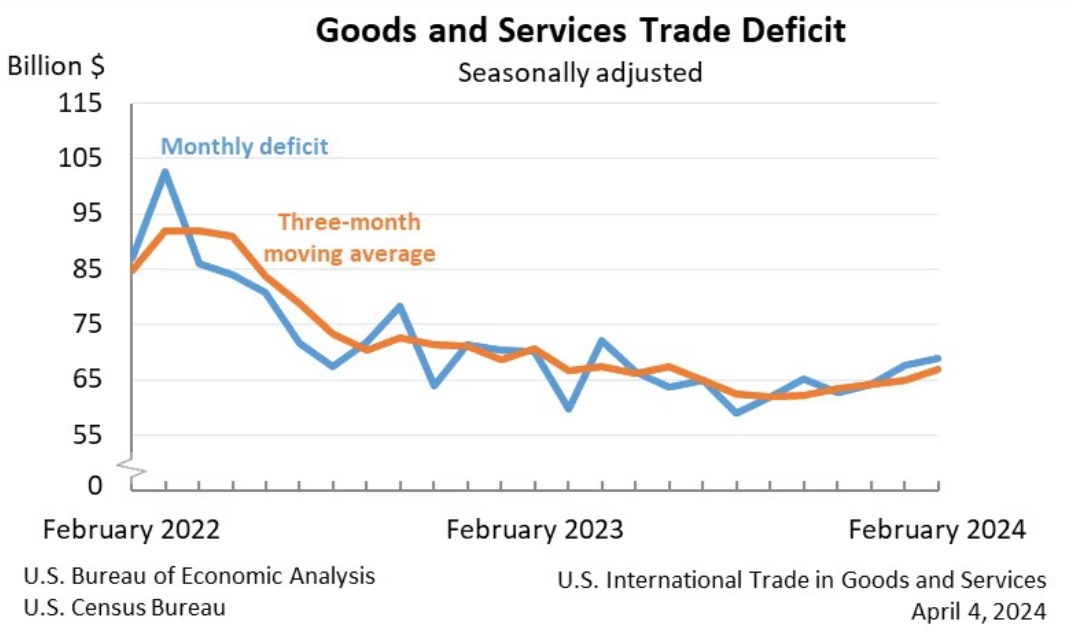
The nation’s international trade deficit in goods and services increased to $68.9 billion in February, as imports increased $7.1 billion from January, according to the U.S. Bureau of Economic Analysis. Year-over-year, the global trade deficit decreased $3.9 billion – or 2.8% from February 2023, as exports increased $9.3 billion and imports increased $5.4 billion.
Further complicating the international import environment, nearly half of supply chain professionals cited shipment delays at U.S. Customs as the leading challenge for cross-border e-commerce, especially as nearly 80% of those shipments occurred by air. That leaves many customs brokers and freight forwarders increasingly reliant on import compliance technology to automate and consolidate high volumes of transactions in a single filing.
Some of those technologies feature in Gartner’s 8 prominent supply chain technology trends for 2024, where artificial intelligence plays a significant role, alongside supply chain data governance, end-to-end sustainable supply chains, and cyber extortion. After reports of freight fraud quadrupled to at least $500 million in 2023 and new threats from ELD worms emerged, cybersecurity, supplier oversight, and efforts to combat double-brokering are becoming increasingly important focal points for many companies.
Signs of a rebounding economy offer more incentives to shore up supply chain practices to protect profit. The Logistics Managers Index expanded for the seventh time in eight months during March – and at the highest rate of expansion since September 2022. Meanwhile, trucking exits from the market continue, creating opportunity for over-the-road demand and pricing to climb. Freight market forecasters expect a bull market pricing cycle to occur later in the year, especially if dry van capacity becomes tighter.
Total Transborder freight between the U.S. and North American countries Canada and Mexico in January 2024 compared to January 2023, according to the Bureau of Transportation Statistics.
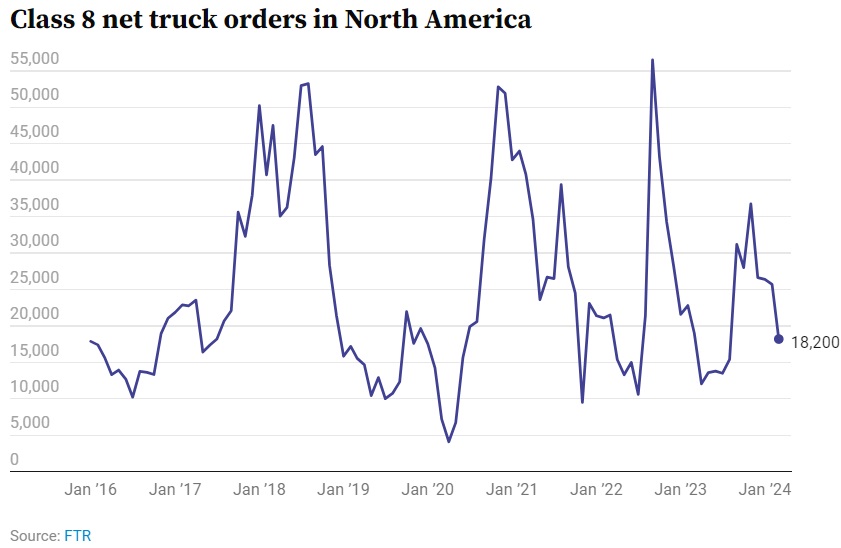
Preliminary Class 8 truck orders decreased 11% year-over-year in March, falling to 18,200 units. Orders for the past 12 months totaled 264,800 units. The March figure is in line with seasonal expectations, according to FTR, and consistent with recent demand trends.
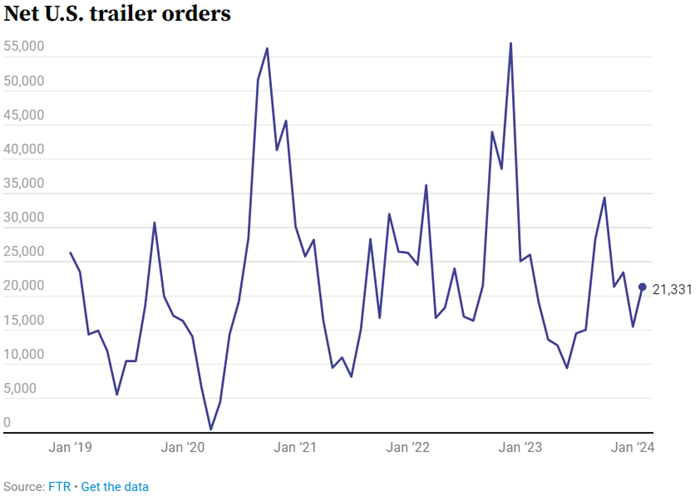
Net trailer orders increased 37% to 21,331 from January to February, however the total is 18% below last year’s level. According to FTR, the backlog-to-build ratio is 5.7 months which is line with the average level for the second half of 2023 and below the historical average before 2020.
Although the less-than-truckload market remains balanced, increasing truckload demand and pricing will incentivize many shippers to capitalize on long-time contracts before rates escalate alongside the spot market, where digital freight marketplace options offer flexible capacity at the best costs.
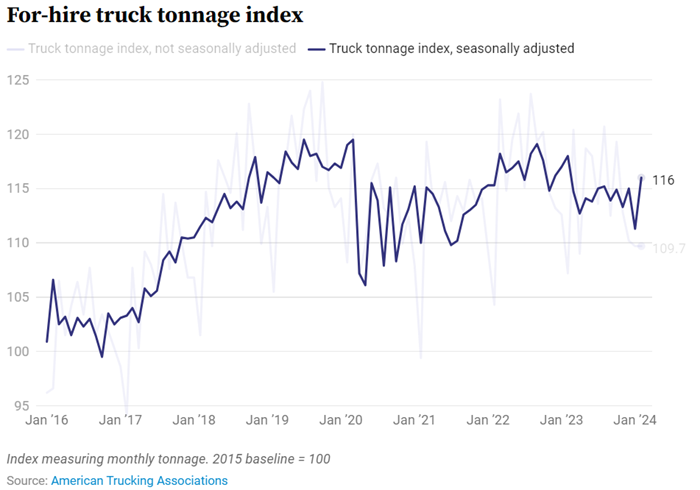
Reflecting freight movements through contracts as opposed to spot moves, the American Trucking Association Truck Tonnage Index increased 4.3% during February compared to the seasonally adjusted prior month. That index level is the highest since before January 2023.
In this complex transportation environment, make sure you protect your profit by using transportation management solutions that offer adaptable planning, multi-modal management, comprehensive visibility and actionable intelligence.
Contact our team today for help and keep an eye on the MercuryGate Logistics Landscape to track evolving freight industry news.
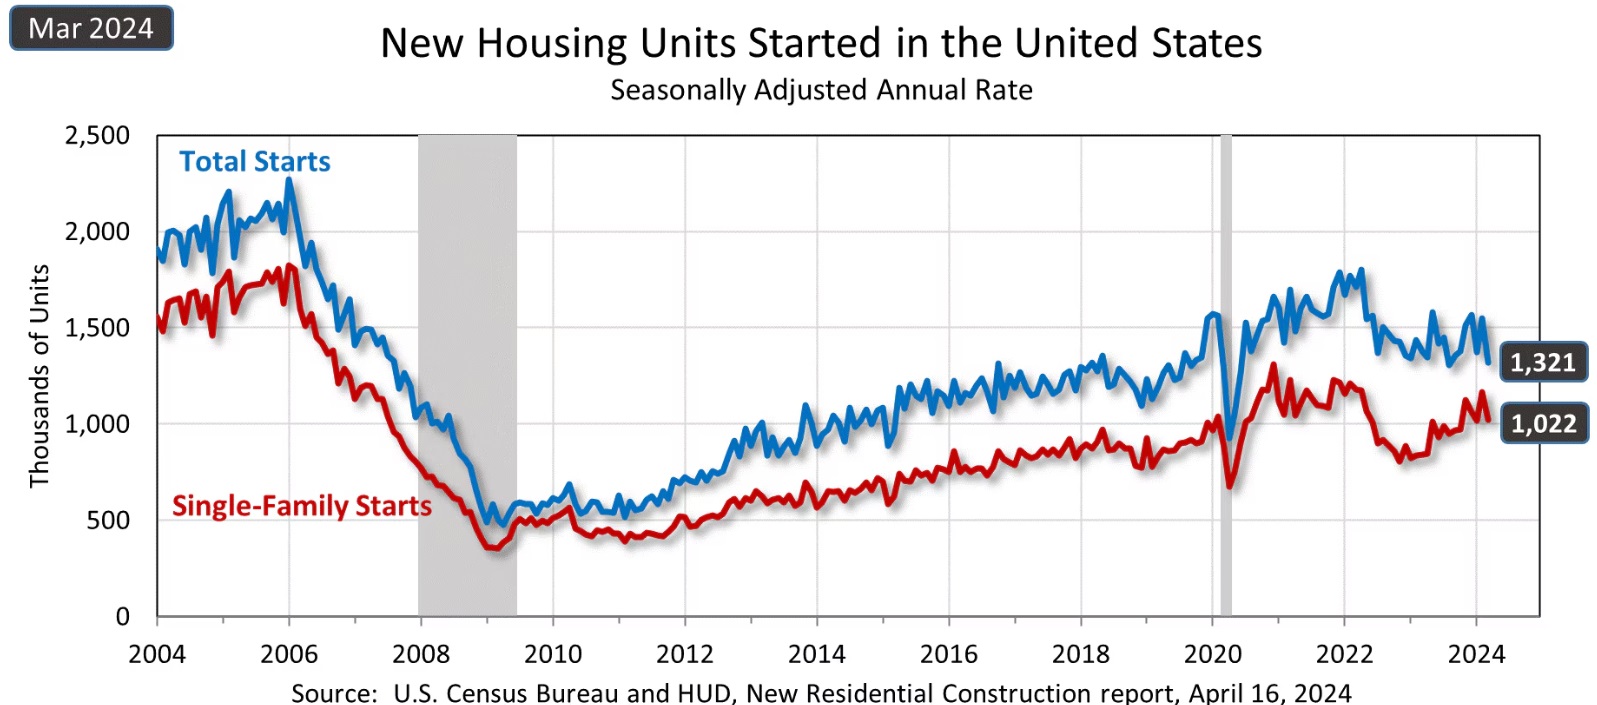
Privately-owned housing starts in March 2024 decreased 14.7% to a seasonally adjusted annual rate of 1,458,000.
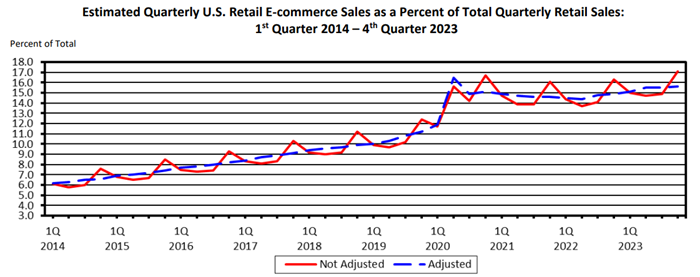
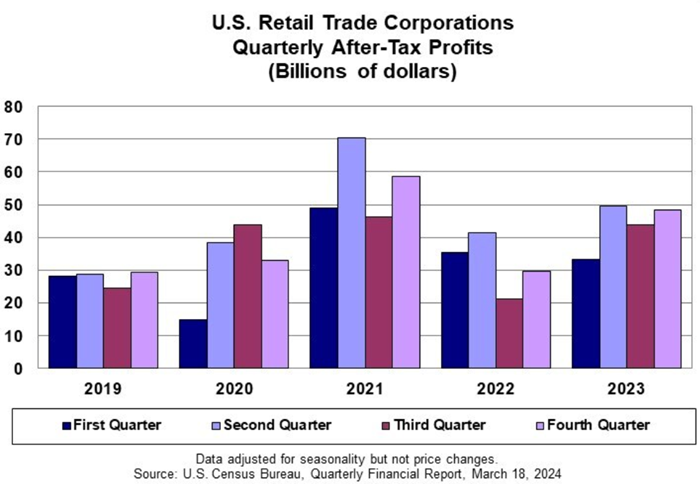
U.S. retail e-commerce sales for Q4 2023 increased 0.8% to $285.2 billion (adjusted for seasonal variation but not price changes) from Q3. Year-over-year Q4 e-commerce sales increased 7.5% from 2022 to 2023, while total retail sales increased 2.8% during the same period. Q4 e-commerce sales accounted for 15.6% of total sales, according to the U.S. Department of Commerce Census Bureau. For the year, total e-commerce sales during 2023 increased 7.6% to $1.118 trillion. At the same time, total retail sales for the year increased 2.1%.
Seasonally adjusted after-tax profits for retail corporations with assets of $50 million+ were $48.3 billion for the Q4 2023 (the 3 months ending Jan. 31, 2024). That total is up $4.4 billion from Q3 2023 (the 3 months ending Oct. 31, 2023). Seasonally adjusted sales during Q4 totaled 1.027 trillion, not statistically different from the 1.041 billion in the Q3, but up 3.27% compared to Q4 2022.
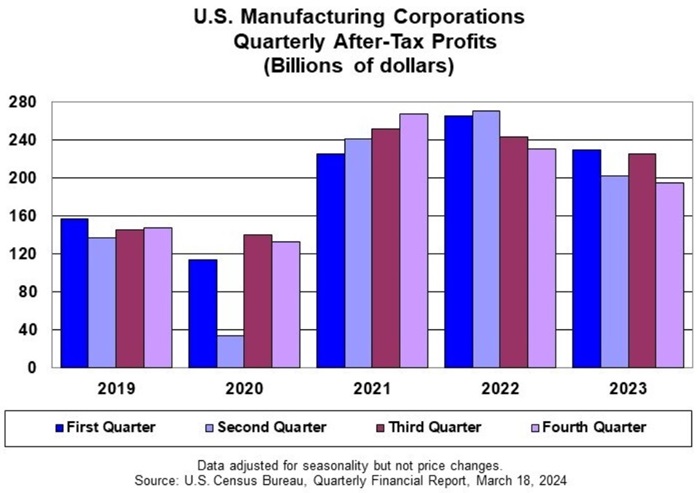
Conversely, manufacturing corporations’ seasonally adjusted after-tax profits declined $30.2 billion or 15.5% from Q3 and Q4 2023 to $194.8 billion. Seasonally adjusted sales for Q4 2023 totaled $1.96 trillion, not statistically different from the 2.0 billion in Q3 2024. Sales during Q4 2023 were down 100 billion compared to 2022.
After three consecutive declines during March, the U.S. average for on-highway diesel fuel climbed in back-back-to-back weeks, according to the U.S. Energy Information Administration’s March 25 report. The national average increased six-tenths of a cent ($0.006) to $4.034, which is up from the March 11 low of $4.004 per gallon and the year’s lowest point of $3.828 in the Jan. 8 report. The March 25 average is $0.094 below the same time last year.
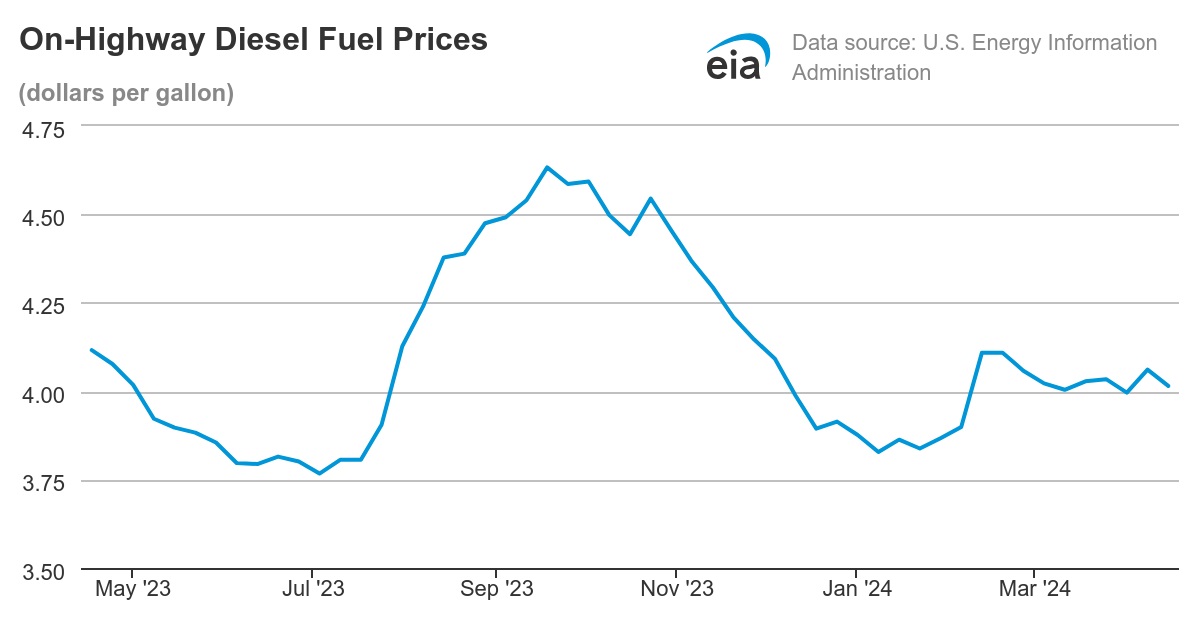
Average prices for on-highway diesel continued to see-saw after three weeks of steady increases to end March, rates are in their third straight week of declines, falling 4.6 cents to a national average of $4.015 in the April 15 report from the U.S. Energy Information Administration. In the same report, the national average is down 10 cents from the same period last year. Prices are lowest in the Gulf Coast region at $3.710 (down 5 cents since April 8), and the highest in California at $5.25 per gallon (down 0.3 cents since April 8).
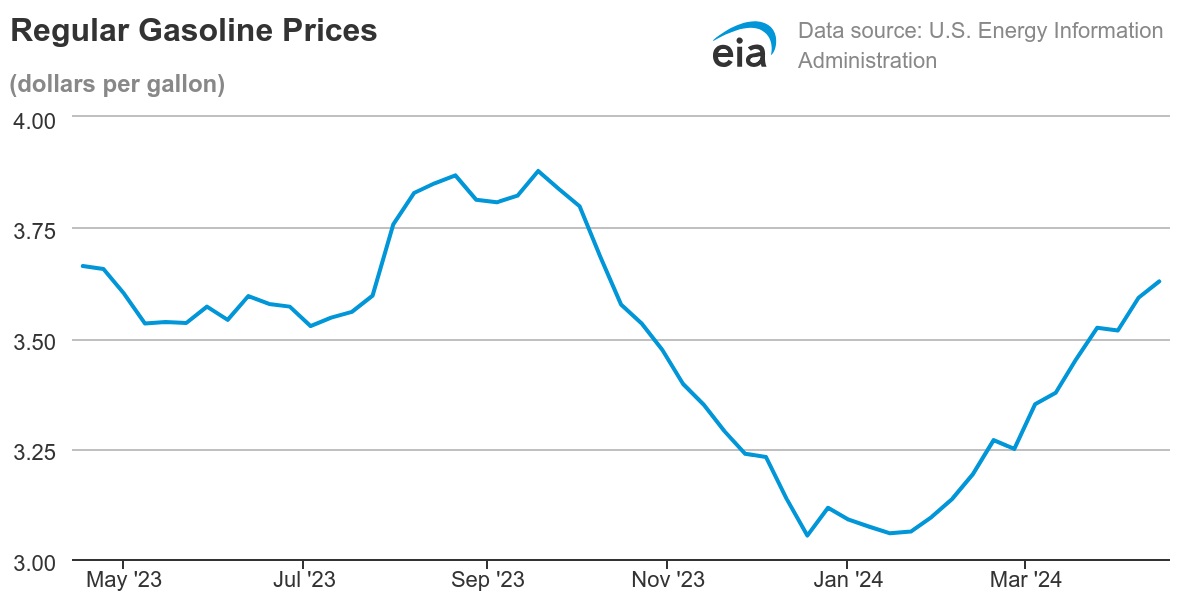
According to the April 15 EIA report, the U.S. average for regular gasoline is $3.628, up 3.7 cents compared to the prior week and down 3.5 compared to prior year. Gasoline prices are the lowest in the Gulf Coast region ($3.177), where they declined 3.8 cents from prior week. Prices are highest in California ($5.271) where they increased 12.9 cents over prior week, and are up 54.6 cents compared to last year. The average price for regular gasoline went up in eight of the nine regions in the EIA’s weekly survey.
After an estimated 3.1% increase in year-over-year holiday sales, optimistic freight industry trends analysts anticipate transportation markets to normalize toward mid-year thanks to various factors.
At the same time, the ongoing environment of sudden disruptions, supply chain shifts, and trade route adjustments pose logistics management challenges in 2024. Those risks mean freight transportation’s “new normal” may be marked by slower growth and a rebalancing of markets instead of a complete rebound for ocean shipping, air freight, trucking, intermodal rail, and parcel.
Let’s examine transportation trends and economic conditions affecting your supply chain cost and service during the year ahead.
MasterCard Spending Pulse reveals 2023 holiday sales grew thanks to a 2.2% in-store sales increase and a 6.3% y/y increase in online sales. The e-commerce increase between Nov. 1 and Dec. 24 is down slightly from the 7.8% Q3 y/y increase that brought quarterly online sales to $284.1 billion – 14.9% of total retail sales, according to the U.S. Department of Commerce.
Now, the returns season intensifies. Last year, shoppers returned 16.5% of items worth $817 billion purchased online and in stores. Merchants are estimated to spend $27 to handle a return for a $100 order, and Gartner reports that companies lose 50% of their margin on returns. Organizations’ ability to manage returns and reverse logistics significantly affects bottom-line performance during 1H.
Up two of the past three months, new orders for manufactured durable goods in November increased $15.1 billion or 5.4% to $295.4 billion. Also up two of the past three months, transportation equipment led the increase, climbing 15.3% or $14.3 billion to $107.8 billion.
At the same time, shipments of manufactured durable goods in November increased 1% or $2.9 billion to $283.2 billion. Again, transportation equipment led the increase, rising 2.3% or $2 billion to $90.3 billion.
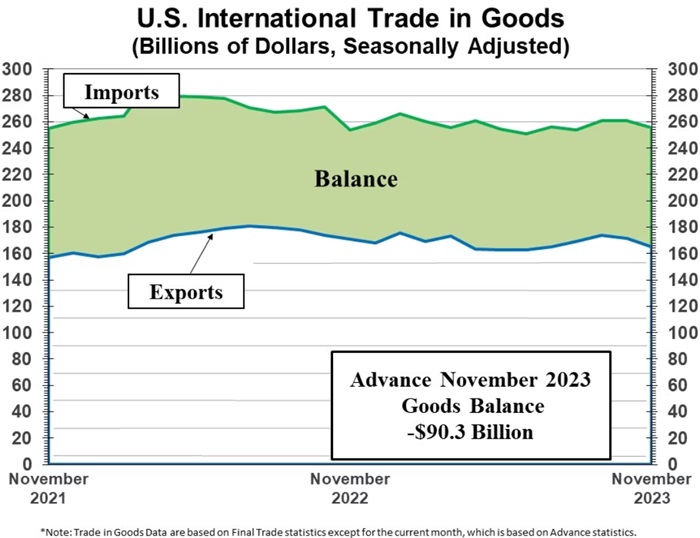
Within this environment, the international trade deficit grew to $90.3 billion in November, up $0.7 billion from $89.6 billion in October. Exports of goods for November were $165.1 billion – $6.2 billion less than October exports. Imports in November were $255.4 billion, $5.5 billion less than in October.
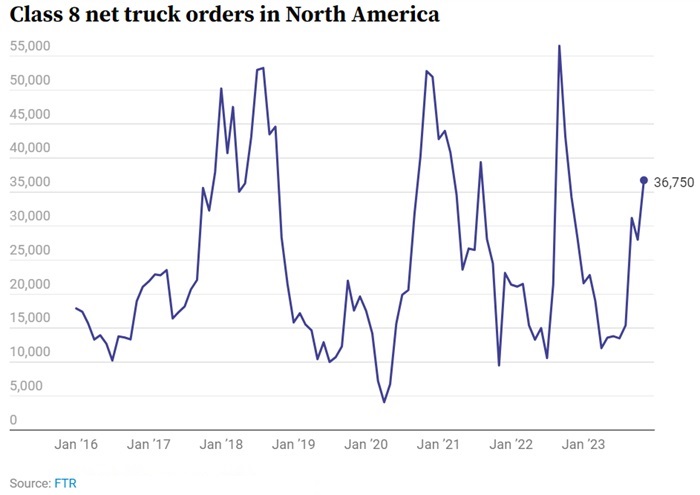
Preliminary Class 8 orders increased to 36,750 units from October to November.
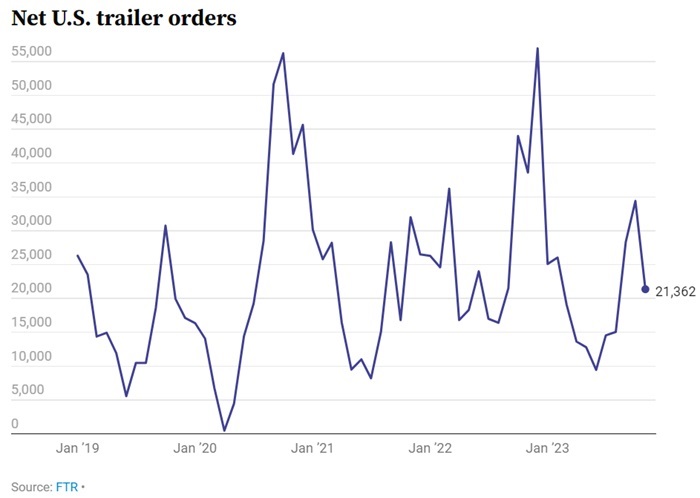
Preliminary trailer orders in November dropped to 21,362, down 38% compared to October and down nearly 42,000 units year-over year, according to FTR.
November’s Logistics Manager’s Index reveals transportation capacity increasing at a faster pace, while prices are declining at higher rate. While November’s LMI reflects mild contraction due largely to inventory shifts, it says, “the North American economy continues to chug along.”
Record profits and diesel price declines allowed many carriers to remain in operation, allowing excess capacity to linger, but DAT Freight & Analytics’ outlook for 2024 predicts the truckload market could normalize by mid-year.
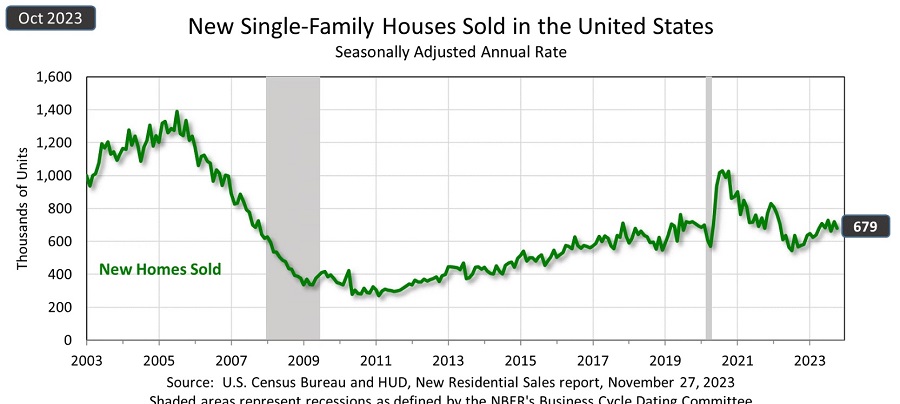
Anticipated interest rate cuts in 2024 could spur housing starts and flatbed demand, especially in the Southeast, where about 60% of the nation’s family homes are built. Nearly one-third of Americans expect mortgage rates to fall, while home-buying sentiments continue to improve.
Expect domestic, cross-border commerce to drive ongoing demand after Mexico surpassed China as the U.S.’s largest trading partner.However, U.S. Customs and Border Protection on Dec. 19 wrote that it violates U.S. Customs laws to use an offshore and unlicensed third-party company to review shipping documents such as bills of lading and commercial invoices. As a result, U.S. brokers can’t use inexpensive offshore labor to reduce costs for import entry preparation.
Meanwhile, geopolitical conflict continues to jeopardize international costs and service times, affecting supply chain performance in the process. Air freight demand is rising, shipping rates are increasing, and transit times are growing. Reliable shipment and order visibility is an asset that helps protect priorities while shippers navigate tumultuous waters.
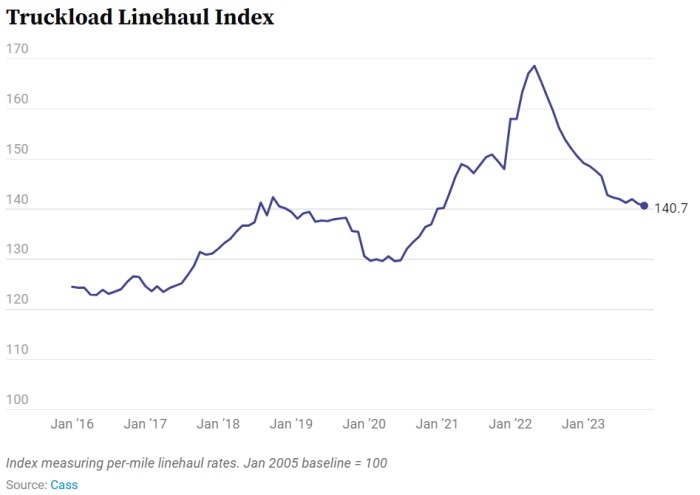
The Cass Truckload Linehaul Index declined 0.3% in November and it is down 7.5% year-over-year.
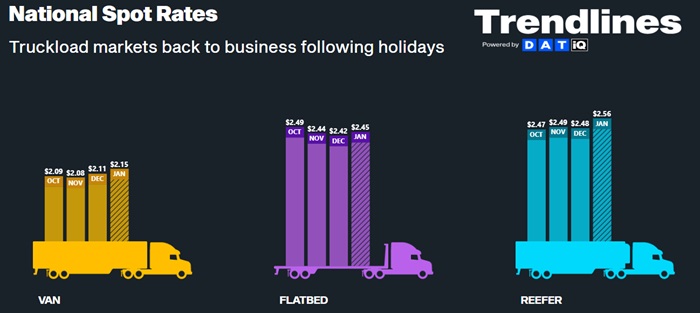
Truckload markets are back in gear after holiday week demand and capacity constraints created a spike in spot rates based on DAT Freight & Analytics Trendlines analysis. After the spike, load-to-truck ratios for each equipment type continued to climb between the week of Dec. 25-31 and the week of Jan. 1 – 7, including dry van (+28.9%), flatbed (+68.5%), and reefer (+0.5%).
Flatbed spot rates decreases 0.7% m/m, while the flatbed load-to-truck ration declined 7.1%. December flatbed spot rates are down 12.5% compared to 2023.
Eight weeks of price declines for on-highway diesel fuel ended on Dec. 25, but the first two fuel reports of 2024 reflects a return to price drops. Since the start of the year, the national average for on-highway diesel declined 8.6 cents to $3.828 a gallon. According to the Energy Information Administration report for Jan. 8, the current U.S. average is 72.1 cents below last year.
Average diesel prices dropped in all 10 of the EIA’s reporting regions for the Jan. 1 and Jan. 8 reports. The average price is highest in California ($5.152) and lowest in the Gulf Coast region ($3.531).
Regular gasoline prices follow a similar trend, with the Jan. 1 national average dropping 2.7 cents to $3.089 per gallon after an uptick that followed several weeks in declines. The U.S. average for gasoline is 13.4 cents below the same period last year.
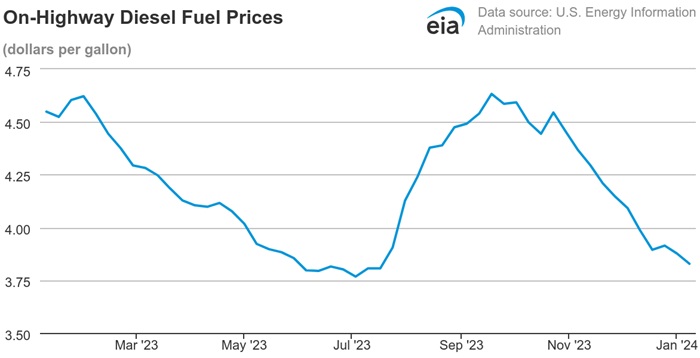
Average prices for on-highway diesel continued to decline during Q4 2023, decreasing 10 out of the past 11 weeks for the U.S. average. In the Jan. 8 report from EIA, the national average is $3.828 per gallon, down 72.1 cents from the same period last year. Prices are lowest in the Gulf Coast region at $3.521, and the highest in California at $5.152 per gallon.
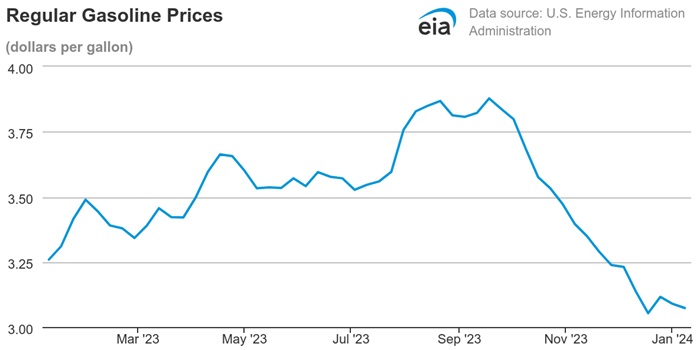
The U.S. average for regular gasoline is down 18.6 cents compared to last year. The national average price in the Jan. 8 report from EIA, $3.073, is down 1.6 cents from the prior week. Gasoline prices are the lowest in the Gulf Coast region ($2.676) and highest in the West Coast region ($4.072).
Global mergers and acquisitions declined 17% to a value of $2.87 trillion during 2023, the lowest level in over a decade, according to London Stock Exchange data. U.S. M&A outperformed international activity, falling 6% to $1.36 trillion.
Still, in the freight logistics sector Q4 M&A moved the value needle, including Hub Group’s acquisition of Forward Air’s Final Mile unit and the TFI International acquisition of flatbed truckload carrier Daseke. Already in 2024, Denmark’s Maersk Tankers acquired Penfield Marine, a U.S. pool operator.
Economic indicators point to a strong start for Q4 – with inflation cooling to 3.2% in October due to lower gas prices. Likewise, the services and manufacturing sectors experiences modest expansion. At the same time, a 17% year-over-year gain in single-family home sales and increases in new residential construction offer more signs for optimism. Year-over-year construction spending is up 4.6% through the first 9 months of 2024, after inching up 0.4% from August to September.
Signs of an economic rebound appear in a 4.6% increase in new orders for manufactured durable goods – the first uptick following 2 months of decline. New orders for manufactured goods during September increased 2.8% – the sixth increase in the past 7 months. More positive momentum comes with National Retail Federation’s expectations for holiday spending to exceed last year: $875 per household, with $620 going to goods and $255 toward consumable items.
Freight volumes for less-than-truckload carriers continue growing in the wake of the Yellow exit from the market. XPO, ABF Freight and Old Dominion Freight line all report strong growth in shipment volumes and pricing power. However, the Journal of Commerce reports that pricing surges are abating.
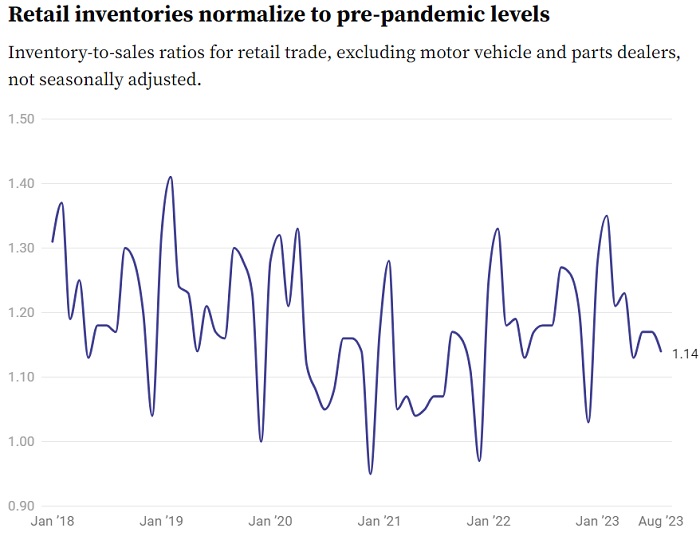
In addition to moderating LTL pricing, that same NRF forecast reminds us that the normalized, pre-pandemic inventory-to-sales ratios won’t help a depressed freight marketplace. A pair of purchasing managers indices released Nov. 1 reflect manufacturing industry contraction and staffing reductions – in spite of a recent uptick in new orders for durable goods.
Global outlook for container trade in 2024 forecasts sagging demand and falling rates – down 48%-67% from a year ago. Shipping and logistics company Maersk plans to cut 10,000 jobs as ocean demand dips. The company reported a third-quarter profit decline of $521 billion, with the Ocean division posting a quarterly loss.
French-based shipping company CMA CGM reported third-quarter profit declined to $388 million – down from $7.04 billion in the prior year. South Korean shipping link HMM saw a 96% decline in profits during 3Q 2023.
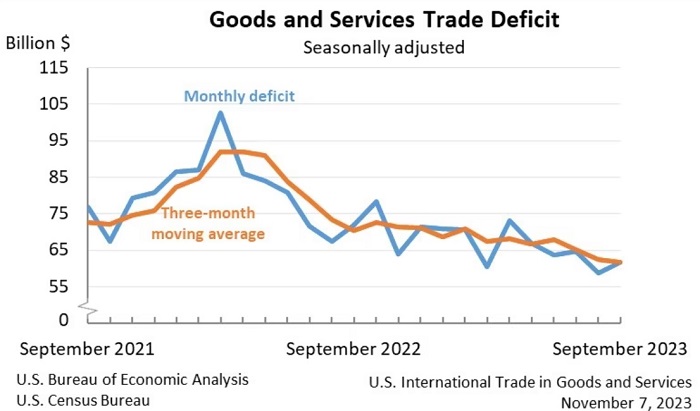
The U.S. deficit in goods and services increased 4.9% between August and September. September exports were $261.1 billion, $5.7 billion more than August exports. September imports were $322.7 billion, $8.6 billion more than August imports. The total deficit, $61.5 billion in September is up $2.9 billion from August’s revised total.
Following the pattern, American Trucking Association’s seasonally adjusted for-hire truck tonnage index for September declined 4.1% from prior year – the steepest decline since November 2020. Muted trucking demand will likely push more carriers out of business – despite a significant jump in preliminary Class 8 truck orders.
During Q3, total trucking capacity declined by 4,312 carriers.
Growing risks – including volatile diesel fuel costs and increases in cyberthreats – exacerbate challenges in the trucking industry and jeopardize profitability across supply chains. Shippers face more cost pressure with matching 5.9% General Rate Increases (GRI) and additional charge increases announced by UPS and FedEx.
Meanwhile, the U.S. Postal Service plans 2024 rate hikes effective Jan. 21. Price increases will affect Ground Advantage, Parcel Select, Priority Mail, and Priority Mail Express according to a filing with the Postal Regulatory Commission.
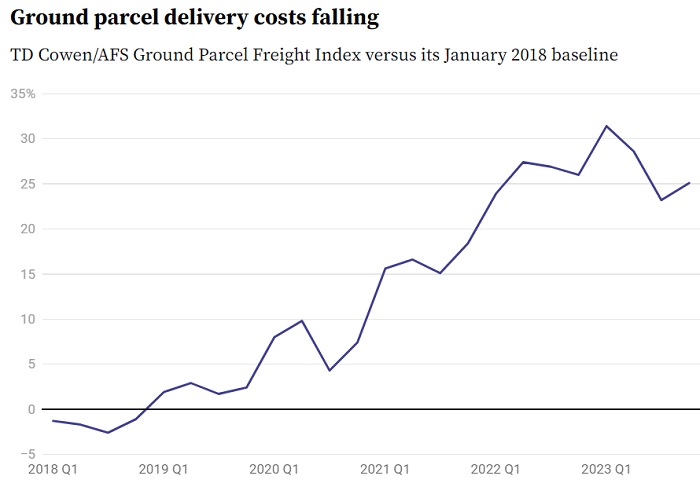
Despite consistent annual parcel GRI, ground parcel rates in 3Q declined year-over-year for the first time since 2019. The decrease in the TDS Cowen/AFS Freight Index was fueled by larger pricing discounts and reductions in added fees and fuel surcharges.
In this logistics landscape, supply chain players are finding solutions in technology. Logistics Management’s 32nd Annual Study of Logistics and Transportation Trends surveyed supply chain leaders about the role of technology – like freight forecasting, route optimization, and back-office automation.
Visualize Your Savings
Simplify Transportation
Personalized or On-Demand
Software For Your Business
Read, Watch & Listen
Industry & Product Info
Stay Up-To-Date on MG
Watch On-Demand
The journey toward greener supply is not without its challenges. The path forward may seem unclear, complex, and even insurmountable at times, but even the
Product News & Updates
Get Product Help
Train & Upskill Users
Find a MG Partner
About MercuryGate
Current Openings
Connect In-Person
Get In Touch
The journey toward greener supply is not without its challenges. The path forward may seem unclear, complex, and even insurmountable at times, but even the
This website uses cookies so that we can provide you with the best user experience possible. Cookie information is stored in your browser and performs functions such as recognising you when you return to our website and helping our team to understand which sections of the website you find most interesting and useful.
Strictly Necessary Cookie should be enabled at all times so that we can save your preferences for cookie settings.
If you disable this cookie, we will not be able to save your preferences. This means that every time you visit this website you will need to enable or disable cookies again.
More information about our Cookie Policy