In this edition of “SONAR Indices & Insights,” the SONAR team showcases trucking revenue benchmarking indices. These can aid asset-based and asset-lite carriers build transportation KPIs that will help managers make decisions that yield higher profits. These indices are in SONAR, the freight forecasting platform from FreightWaves.
This week, learn how executives who manage a trucking business are monitoring these SONAR revenue indices to benchmark trucking revenue and improve decision-making that yields higher profits. In this article, leaders will learn about three SONAR indices that are focused on revenue granularity monitoring:
Revenue per driver per week (DRVREV)
Percentage of Brokerage Revenue (BROREV)
Net revenue per truck per week (NETREV)
Which SONAR indices allow carriers to track trucking revenue and improve profits?
There are three indices that provide trucking leaders the freight and trucking data they need to build freight KPIs that keep abreast of revenue in specific granularities. They can aid in benchmarking and monitoring trucking revenue. When leaders are able to track revenue in granularities such as by driver, truck and the percentage of revenue from brokers, they are able to make decisions that impact costs and improve both revenue and profits. We’ll start by first defining what is the Revenue per driver per week (DRVREV) index, followed by defining each of the remaining two indices that allow executives to monitor revenue and impact profits. Let’s teach you what each index measures.
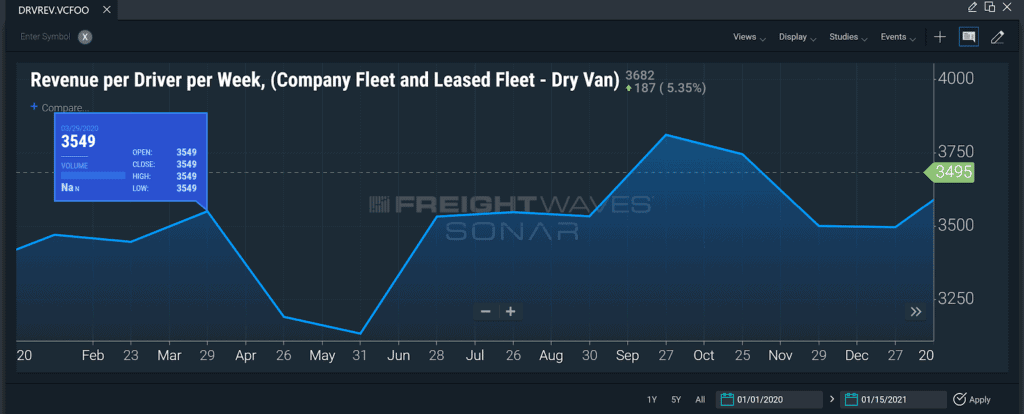
Revenue per driver per week (DRVREV)
The Revenue per driver per week (DRVREV) index captures the total amount of Linehaul and Accessorial revenue generated per week, expressed on a “per-driver” basis. Fuel surcharge is excluded from this index. The count of drivers included in the index captures both full-time and part-time employees, as well as independent contractors.
For part-time, the counts are reported on a full-time-equivalent (FEL) basis. The carriers reporting the data for this index are participants in the Truckload Carriers Association’s TPP program.
In the chart above, users can view how rates and asset utilization are affecting revenue.
Using this information as a benchmarking figure, carrier leaders can get a good idea for how van, reefer and flatbed carriers are navigating the freight market each month and thus see how that may impact overall trucking revenue. When revenue per driver per week is increasing, carriers are more effectively utilizing their drivers as measured by increased shipping freight rates, volumes or equipment and personnel management.
There is a correlation between revenue per driver per week and freight activity.
Revenue per driver per week is updated monthly and is based on a sample of over 300 carriers mixed between primarily dry van, flatbed and reefer trailer types. The fleet sizes range from small to large, representing a well-balanced mix of carrier types.
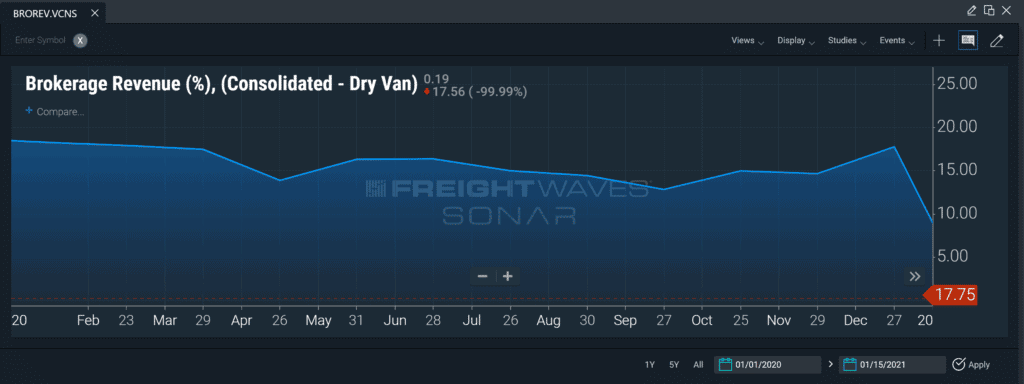
Percentage of Brokerage Revenue (BROREV)
The Brokerage Revenue (% of Total Revenue) index calculates the total amount of trucking revenue generated by a carrier’s brokerage operation/division, expressed as a percentage of revenue generated by the carrier’s asset and asset-light activity. As with DEVREV, the carriers reporting the data for this index are participants in the Truckload Carriers Association’s TPP program.
Formula for BROREV: Total brokerage revenue divided by (brokerage + linehaul + accessorial + fuel surcharge revenue) multiplied by 100.
The SONAR chart above shows the BROREV index over time. These percentages as reported by the TCA’s TPP program saw a relatively stable reading in 2020 of around 15.00.
On an aggregated basis, the BROREV index shows the degree of brokerage activity performed by carriers relative to their asset-based operations. Typically, carriers will use their brokerage divisions to handle the ‘overflow’ freight tendered to their asset-based division. In a robust freight market, the percentage of overall trucking revenue will tend to track higher as the capacity from the asset-based division is restricted by the supply of drivers and trucks.
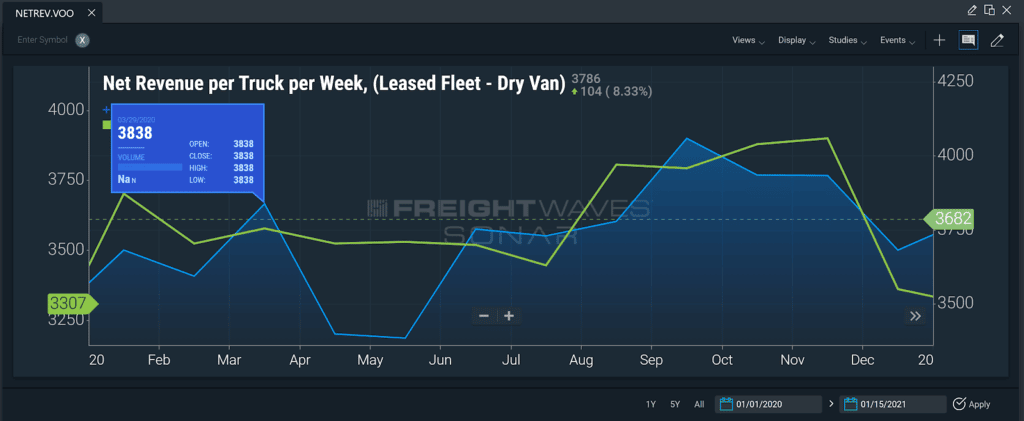
Net revenue per truck per week (NETREV)
The Net revenue per truck per week (NETREV) index provides a measure of how well a carrier’s trucks are operating in a week-by-week view. A stronger NETREV indicates higher profitability and potentially more moves across all activities, as well as increased linehaul and accessorial revenue. As with the other two indices, this metric is part of the Truckload Carrier Association’s TPP Program.
The formula for NETREV is as follows: Percentage of brokerage revenue = total brokerage revenue / (brokerage + linehaul + accessorial + fuel surcharge revenue) multiplied by 100.
The SONAR chart above shows the NETREV index compared in the dry van and flatbed equipment types. Using SONAR, leaders at a trucking business can benchmark their per truck per week trucking revenue to other carriers participating in the TCA TPP Program.
All carrier types, including asset-based, light and some brokers, will be most interested in NETREV. It helps to guide annual trucking RFP decisions, particularly for trucking companies with limited equipment and those looking to onboard new lanes or expand the volume of trucks in operation.
The NETREV index is yet another model of carrier profitability, but carriers can further extrapolate insights by creating calculations for each driver and comparing them to a company average. In turn, carriers will be able to see how their brand performs in benchmarking and benchmark internal factors to enable continuous improvement.
Benchmark trucking revenue and improve profits by purchasing and using SONAR
In turbulent times, asset-based and asset-lite trucking leaders need certainty to stay ahead of the freight market and understand the impacts any current market is having on revenue. The premier freight forecasting engine, FreightWaves SONAR, allows carriers to benchmark, analyze, monitor and forecast operating costs in an effort to increase profitability.
SONAR ensures more proactive responses to the market, provides correlations between several indices to guide decisions and builds a smarter data-driven trucking business. Click the button below to get a demo of SONAR to see what the platform can do for you.