


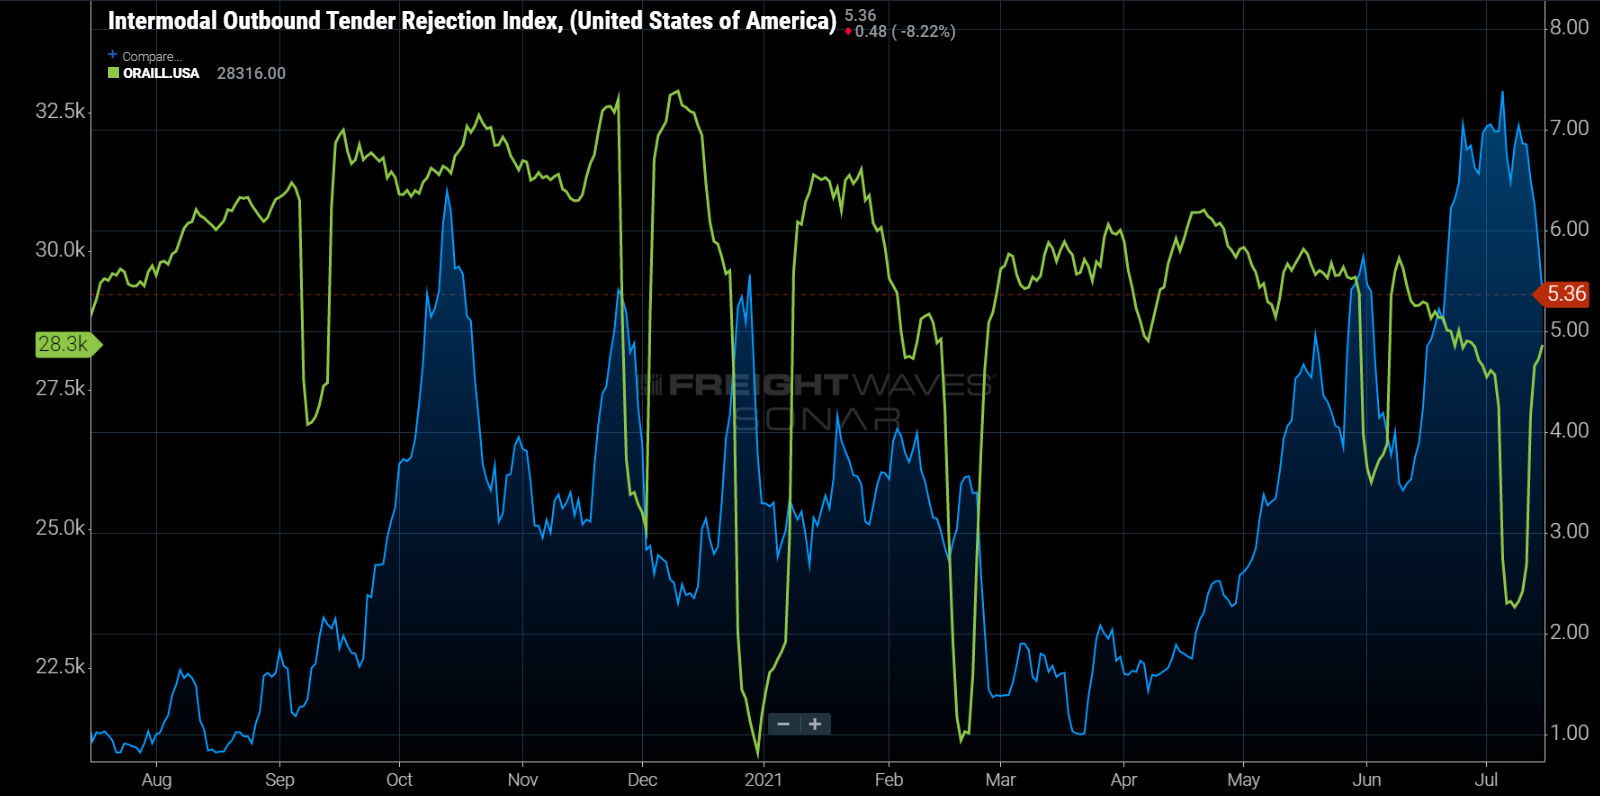
Chart of the Week: Intermodal Outbound Tender Reject Index, Outbound Rail Loaded Container Volume – USA SONAR: IMOTRI.USA, ORAILL.USA
Intermodal rejection rates peaked near all-time highs over the past month as volumes fell. Looking over the past few months, volumes, measured by FreightWaves Outbound Loaded Container Volume Index (ORAILL), were actually higher in March and April while rejection rates fell below 2%. With trucking capacity extremely tight, are intermodal providers losing market share?
It is counterintuitive to see demand (volumes) fall and capacity appear to tighten — indicated by an increase in tender rejections. It seems as though intermodal carriers are reducing their available capacity for contracted customers. It is rare to see an intermodal tender rejection due to the nature of the business. Many providers automatically accept load requests because it is almost like guaranteed capacity — but the service is not.
When asked about this phenomenon, rail and intermodal market expert Mike Baudendistal said, “Terminals are congested, boxes are not leaving fast enough and IMCs (carriers) have been too aggressive about raising rates for how the service levels are … leading to share loss to the highway.”
Basically, the cost savings for shipping on the rail is not enough to offset the deterioration in service. This explains the deterioration in volumes over the past few months to an extent, but the tender rejections indicate the carriers may be struggling to meet demand anyway. The timing is just unusual.
Looking at the intermodal rejection rate at a market level, the bulk of the rejections can be explained by a large jump from loads originating in Southern California. The single largest lane for intermodal shipments in the U.S. is Los Angeles to Chicago, a lane that has struggled to keep pace with demand for several months.
Peak season surcharges were put in place this spring, even though it is not the traditional peak season for freight for the rails. Union Pacific announced a temporary suspension of eastbound movement from the West Coast terminals to Chicago — this is due to congestion in Chicago because of a lack of drayage capacity.
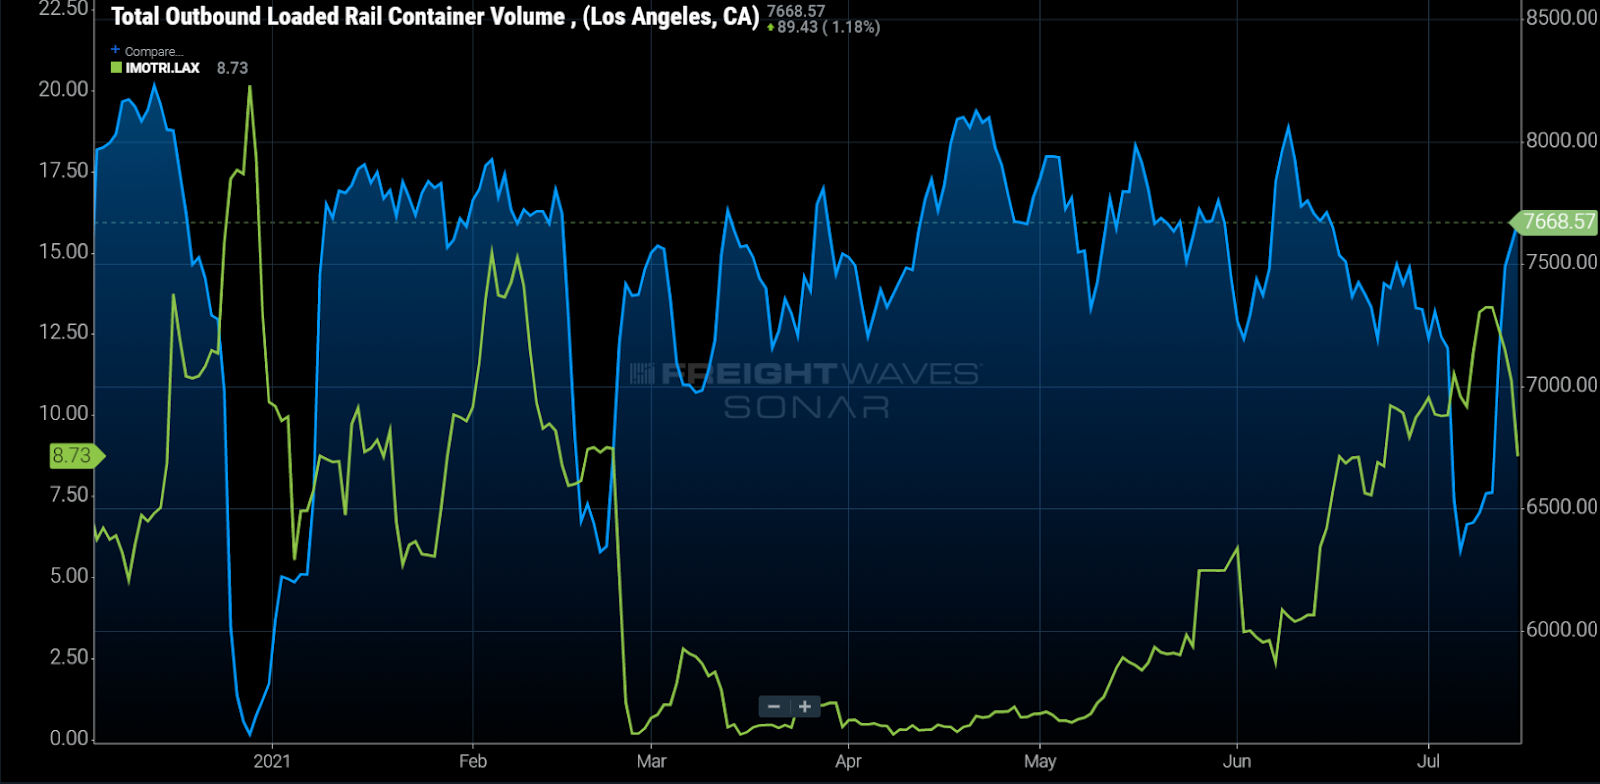
Volumes have been trending lower out of LA as well, meaning there should be more capacity, but that does not appear to be the case looking at the rejection rates. Congestion in Chicago may be contributing to the rise in rejections.
International versus domestic containers
Looking at the domestic versus international loaded container volumes, the majority of the deterioration comes from the international container segment that consists of 20- and 40-foot containers that largely originate from overseas.
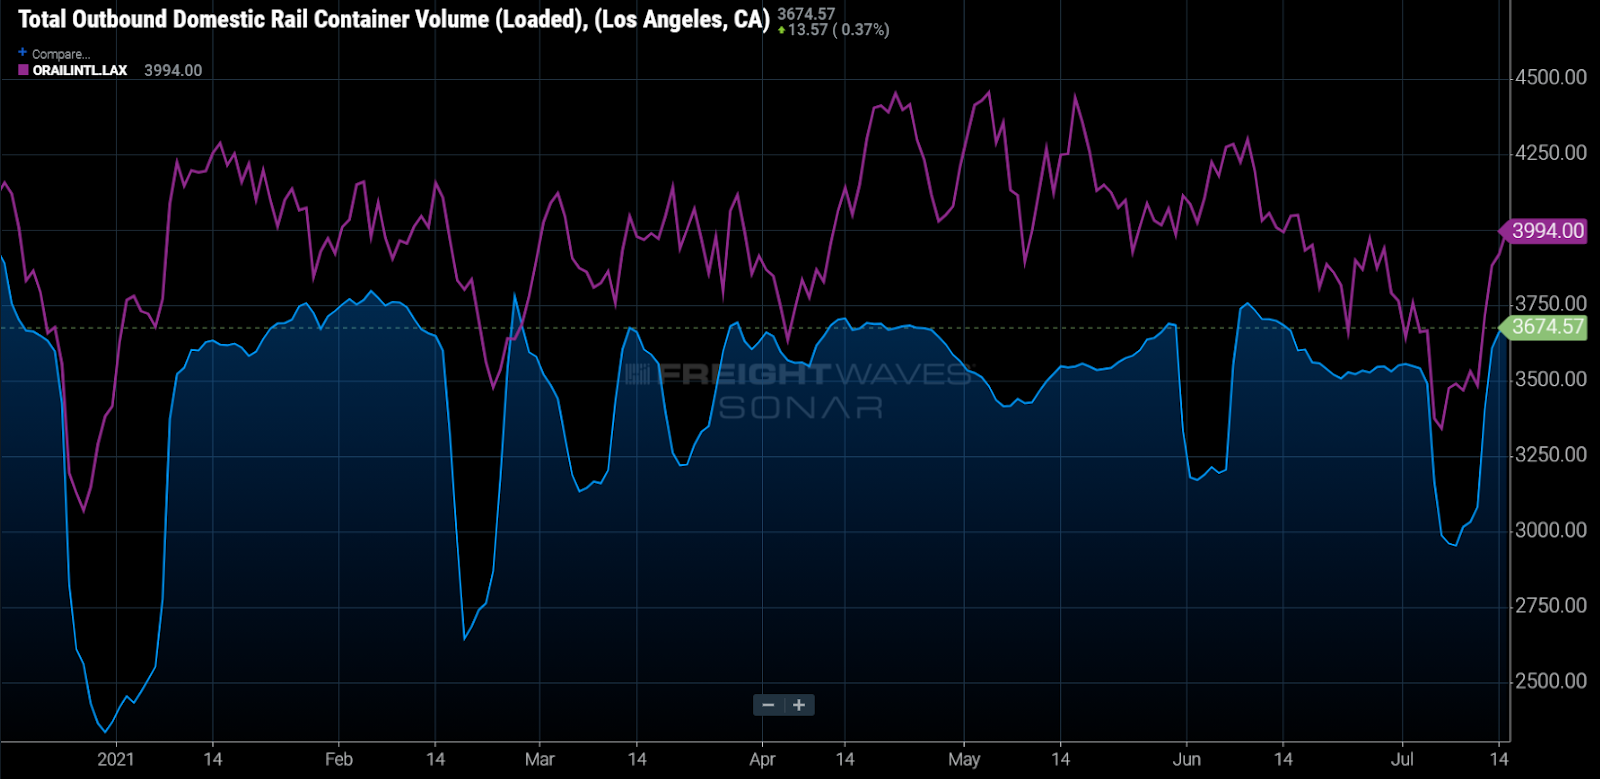
These containers have become a rare commodity and are not owned by the rails. With the container shortage becoming an increasing issue, the shipping companies that own these containers are making more of an effort to move them back across the ocean where they are needed and can make them the most money.
This means these containers have to be emptied into warehouses or transloaded, preferably close to the ports. With the numerous delays and congestion around the ports and rail facilities, a lot of this freight will get palletized and placed on trucks, which after a round of significant rate increases and surcharges, is not as much of a premium as it used to be.
The rails are not totally to blame for the service deterioration — drayage capacity/container shortage — but they have historically sacrificed service for operational efficiency and now they are charging more for less (service). Trucking compliance rates have started improving from their historic lows, which may mean that intermodal may have missed its peak opportunity for growth.
About the Chart of the Week
The FreightWaves Chart of the Week is a chart selection from SONAR that provides an interesting data point to describe the state of the freight markets. A chart is chosen from thousands of potential charts on SONAR to help participants visualize the freight market in real time. Each week a Market Expert will post a chart, along with commentary, live on the front page. After that, the Chart of the Week will be archived on FreightWaves.com for future reference.
SONAR aggregates data from hundreds of sources, presenting the data in charts and maps and providing commentary on what freight market experts want to know about the industry in real time.
The FreightWaves data science and product teams are releasing new data sets each week and enhancing the client experience.
To request a SONAR demo, click here.

Mikey
1st. Bring back furloughed employees. 2nd. Bring mothballed equipment back on line. 3rd. Start putting money back into services instead of cutting service to make money upfront for the CEO’s at the companies long term expense.