

IMAGE ABOVE: FWS.USA (Dry van) compared to FWSR.USA (Reefer): FreightWaves Scientific Van Rate Per Mile Current Day Rate Ticker)
In this edition of “SONAR Indices & Insights,” readers will learn about the FreightWaves SONAR Scientific Rate (FWS.USA) tickers, added to SONAR so subscribers that wish to backtest the predictive freight rate models against their own performance and provide a degree of comfort and accountability into SONAR’’s Scientific predictive rate models.
A key advantage of SONAR is that it provides predictive analytics so that subscribers can see what linehaul rates are forecast to be in the future. The introduction of Scientific National Truckload Rates Per Mile indices, which present SONAR Lane Signal data predictions in a ticker format for faster review and application, allow SONAR subscribers to have confidence that predicted rate per mile projections in SONAR are accurate or provide an opportunity to dig deeper when there are large deviations between the predictions on spot market linehaul rates vs. the final observed linehaul tender rates.
This week, learn how SONAR subscribers are using these scientific rate tickers tracking linehaul rate accuracy from predictions to gain several benefits. Additionally, we will explain what are the FreightWaves Scientific Rate tickers and how they track both 7 and 28 days worth of predictive rates accuracy providing a sense of confidence in FreightWaves SONAR’s ability to predict accurate linehaul rates and help all segments realize more informed decision making.
SONAR’s proprietary algorithm is designed to predict and portray buy-side (shipper/broker to carrier) spot market linehaul rates for over 750,000 lanes in the U.S. (excluding lanes under 250 miles in length). The algorithm ingests millions of data points, including but not limited to tender data, operational costs, and demographic information and projects them 28 days into the future.
There is a ticker for the national scientific van rate with a 28-day prediction as well as a ticker for the national scientific reefer rate with a 28-day prediction. Another ticker illustrates the weighted average of the scientific rates. The weighted average calculation weights each lane’s value based on volume derived from tender data. It values lanes with higher volumes more than lower volume lanes.
It should be noted that every value after the previous day’s date is predicted and subject to daily fluctuations until the day arrives.
In addition, there are tickers that show historical predicted values for the 7- and 28-day van and reefer rates. These are static representations of the predicted rates that will not change, unlike the predicted linehaul values. This enables a SONAR subscriber to see the historical accuracy overtime of the SONAR predictive algorithm based against the observed resulting linehaul value.
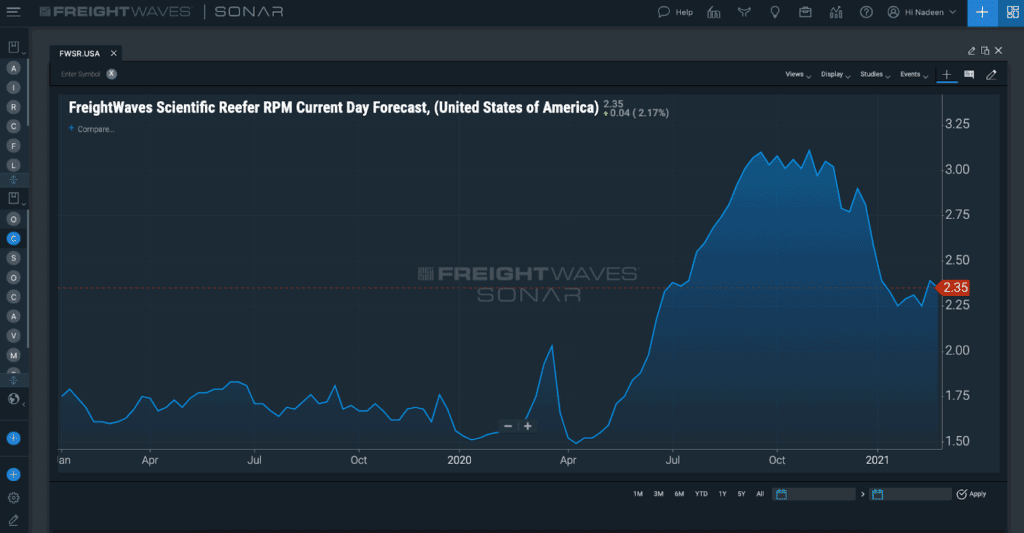
The SONAR chart above demonstrates the gradually observed rate predictions over time across an aggregate of all Lane Signal linehaul rate data and effectively maps out the ability to determine how well SONAR insights aligned to observed rates based on tendered data.
FWS7.USA is a day-by-day comparison of historical predicted values for a 7-day duration for freight rates and are represented against the current reported rate shown within FWS.USA. As a moving ticker, the FWS7.USA is continually comparing the projection for a single day, shown in the blue as FWS.USA, against the observed rate at the close of the day prior day. As such, the value after the previous day’s rate data within FWS.USA is predicted and subjects to daily fluctuations until the day arrives.
FWS28.USA is also a historical predicted value for the 28-day rate and shown in the green line-graph as a representation of the predicted rates based on the most recently observed data. Again, as a moving ticker, it will adjust to reflect the prior day’s tendered rates within SONAR and the varieties going into algorithms within the prescribed Lane Signals from across the U.S.
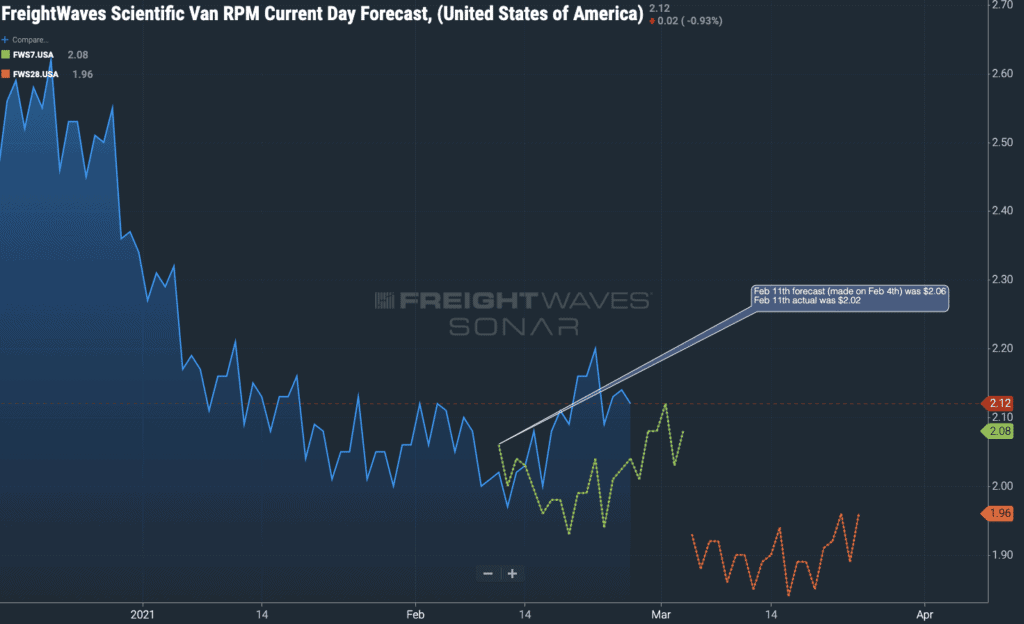
Take the above graphic for example:
Together, these indices, updated based on the prior closing day’s tender data, provide a measure of how accurately SONAR Lane Signal data aligns with observed tender activity and rates over time.
With this data, shippers could better understand the value proposition behind investment into FreightWaves SONAR, particularly the use of the Lane Signal App, including its forward-looking, inclusive predictive rates, SONAR Signal gauges for assessing carrier-versus-shipper buying power and more. As the variance between the FWS7.USA and FWS.USA grows, it indicates a likely influence that contributed to a higher deviation from what was expected versus what was reported within the prior day’s closing tender data.
That same fact applies to the FWS28.USA to FWS.USA comparison. However, the overall track between the three line-graphs creates a sense of confidence in FreightWaves SONAR’s ability to predict accurate tender rates and help all segments realize more informed decision making.
As both FWS7.USA and FWS28.USA generates more line-graph by line-graph comparisons, FreightWaves SONAR continues working in the background. It then creates a weighted average of all lanes to create a likely linehaul rate trend for the next year based on the influence of volumes within individual freight markets.
For example, in FWS, the straight average of all lanes is set to a value of 1 per lane. The weighted average multiples the lanes by a derived volume to account for demand. As an example, if ATL-CHI has 30 loads and MKE -BIS has loads, the ATL-CHI rate is used 30x while the MKE-BIS has 2 inclusions within the calculator. It’s highly like a weighted calculation used to differentiate higher-intensity course curricula in an educational institution.
Minor data indifferences aside, such as slight impacts from highly localized market disruption, not national influences, the weighted average, represented below by FWSW.USA, will decline to 1.66 by February 2022.
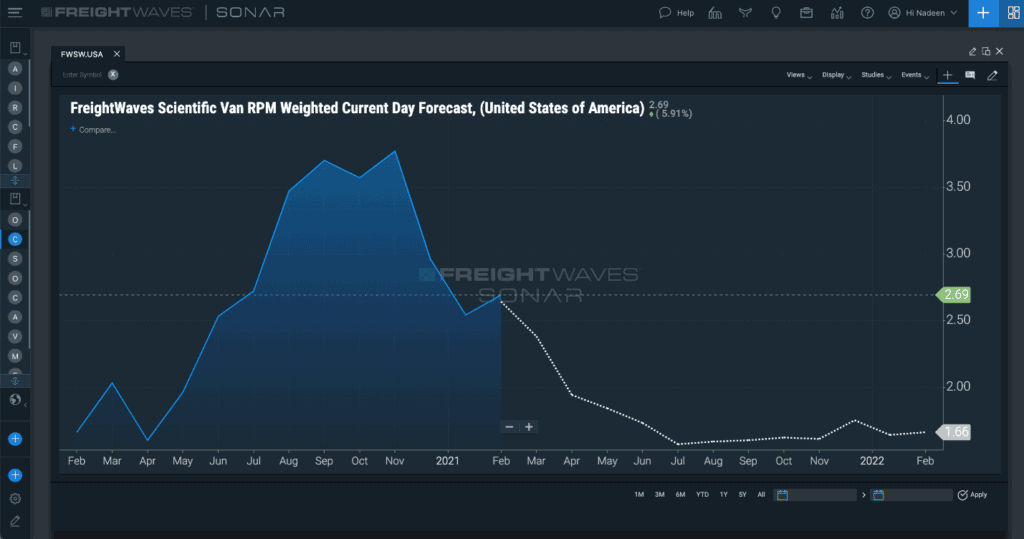
The implication is that the overall truckload rate market will achieve a continued decline as stability returns, which will likely coincide with cooling of spot freight rates and a generalized return to annual contract freight activity. That is, however, subject to the changes arising within the aggregate FWS.USA rates from all Lane Signal data, so new, national and major disruptions could have an impact on the FWSW.USA. Using the proprietary algorithms, FWSW.USA is able to effectively isolate the market trend from major disruptions, so carriers, brokers and shippers can stay strategic and navigate the freight market.
In summary, the FreightWaves Scientific Rates tickers that backtest linehaul predicted rates with observed linehaul tendered rates are defined as follows:
These linehaul rates provide a predictive outlook for national spot rate movement over a 28-day period as well as provide a historical view of how market conditions have changed. Knowing if spot rates are expected to climb or decline can help users make more accurate decisions for either acquiring or pricing capacity in the near-term.
Variances in the predicted values can also help users identify and explain market anomalies when the market diverges rapidly from expectations formed from the market information available up to month ahead of execution. And having a marketwide view within these tickers helps to quickly assess overall market conditions.
Historical data provides insight into how the market has behaved over time, which can assist in either benchmarking or validating decisions related to securing or selling truckload capacity.
SONAR uses tendered data to derive meaningful, actionable insights. With the new Scientific National Truckload Rates Per Mile indices and tickers:
“SONAR’s ability to predict rates is one of the key features that sets it apart,” said FreightWaves’ Chief Data Scientist Daniel Pickett. “These new charts expand the use of the predictive rate tool by letting a SONAR subscriber examine predictive and historical rates in a more visual manner.”
There’s a final implication worth mentioning too. The crossroads that reside between all these FreightWaves Scientific Rate per Mile indices proves beyond a shadow of a doubt that SONAR can and does pay for itself through its extensive algorithms and wide-reaching insights based on the most near-real-time data available.
FreightWaves SONAR is the fastest and most comprehensive freight market data and analytics platform in the world. These are just a few of the 150,000+ unique indices available to SONAR subscribers. Not a FreightWaves SONAR user yet? Sign up for a demo here or by clicking the button below.


