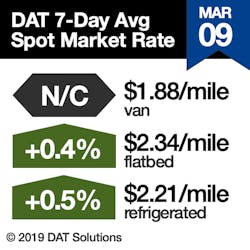
After eight weeks of declines, national average spot van and refrigerated freight rates stabilized during the week ending March 9, said DAT Solutions, which operates the DAT network of load boards.
An increase in spot rates is a sign that demand from shippers and freight brokers is picking up. However, the market is still looking for traction: van and reefer load-to-truck ratios declined last week and higher rates were concentrated on a handful of lanes.
National average spot rates:
- Van: $1.88/mile, unchanged
- Flatbed: $2.34/mile, up 1 cent
- Reefer: $2.21/mile, up 1 cent
National average load-to-truck ratios:
- Van: 4.2 loads per truck, down from 4.6
- Flatbed: 25.9, up from 25.7
- Reefer: 5.6, down from 6.0
Van trends: While van volume on the spot market is almost identical to this time last year, only 26 of the top 100 van lanes saw rates rise last week; 59 lanes were lower and 15 were neutral.
Texas freight availability is heating up with higher load-to-truck ratios and relatively solid van rates from Houston ($1.72/mile average) and Dallas ($1.64/mile) last week. The Dallas-to-Los Angeles lane surged 20 cents to $1.46/mile.
Reefer trends: Despite a 1-cent rise in the national average spot rate, reefer activity is in a seasonal lull. On the top 72 reefer lanes last week, rates on 29 lanes moved higher while 40 lanes declined and three were neutral. Volumes were down only slightly from the previous week.
Average outbound rates increased in Fresno, Calif., and McAllen, Texas, two of the nation’s top produce markets. Lanes with big price increases included McAllen to Dallas, up 23 cents to $3.03/mile, and Fresno to Denver, up 9 cents to $2.45/mile.
DAT Trendlines are generated using DAT RateView, the industry’s largest database of truckload rate information. DAT RateView is based on more than $60 billion in freight payments and 256 million freight transactions annually.


