Carbon intelligence data improved in FreightWaves SONAR SCI

The FreightWaves SONAR Supply Chain Intelligence (SCI) platform now features emissions calculations that are compliant with the GLEC Framework, deepening its carbon intelligence data. The Global Logistics Emissions Council (GLEC) provides a robust, internationally accepted framework for calculating supply chain carbon emissions. The framework is used by shippers, carriers and logistics service providers around the world to help make business decisions that reduce emissions and track progress toward climate goals.

FreightWaves has adopted the GLEC calculation methodology. This enhancement will make it easier for companies to use the SONAR SCI carbon intelligence data across multiple mediums and know that parties across the globe will understand and trust the source information without requiring deeper explanation.

Carbon emissions calculations were part of the SONAR SCI application when it was introduced in April. Now that calculation is a step closer to being universally accepted. 

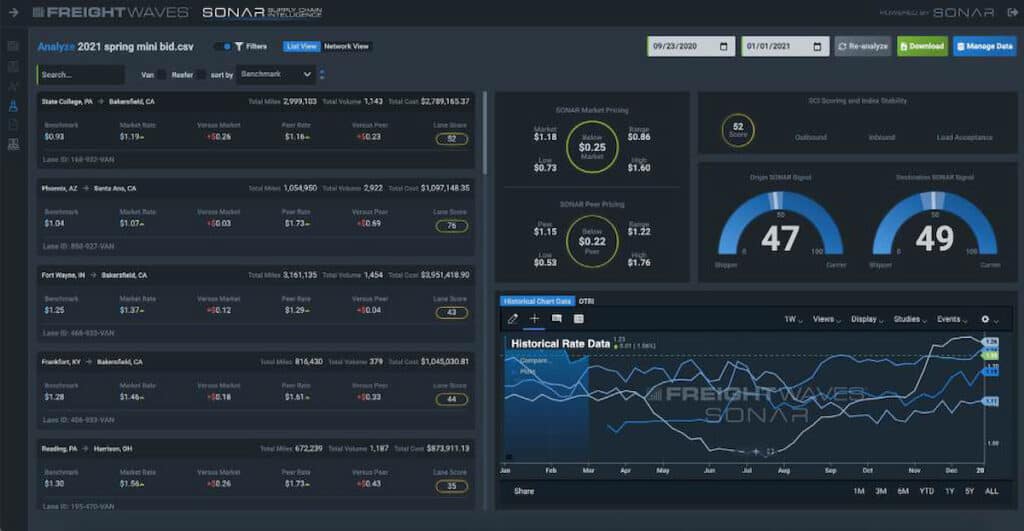
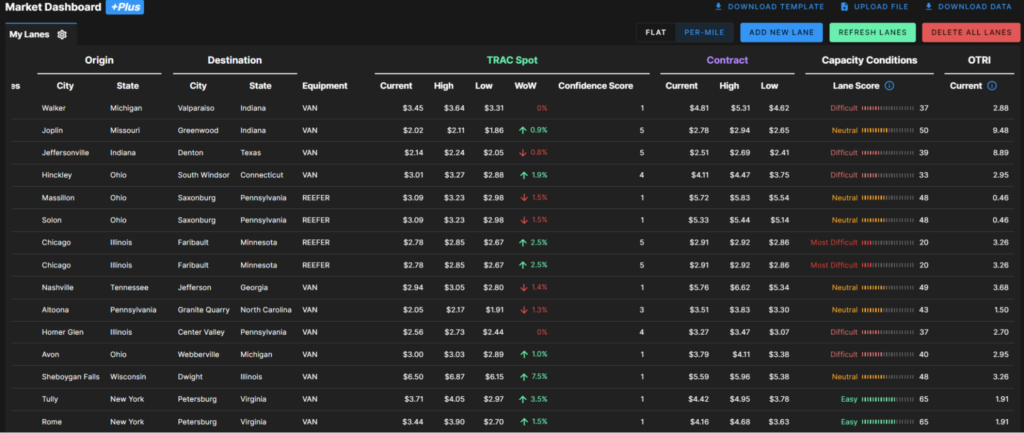
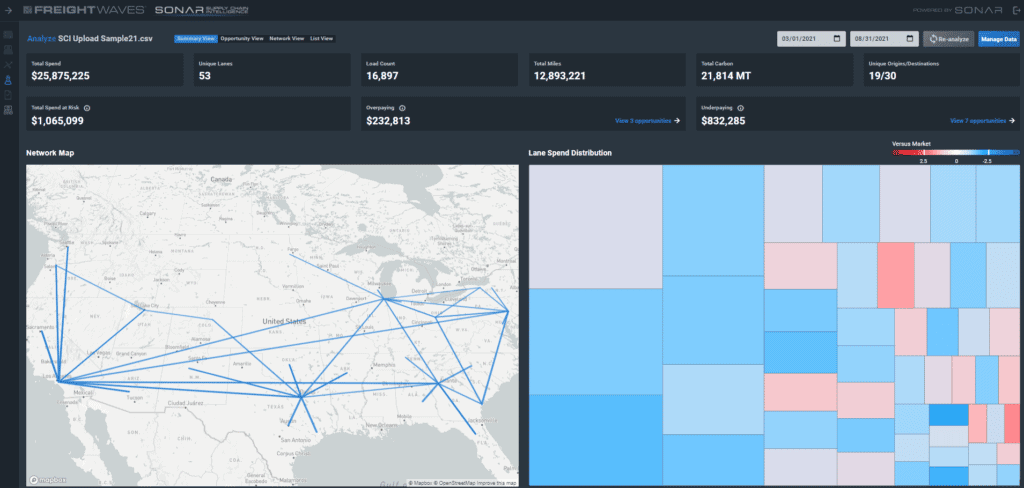
SONAR SCI ingests truckload data and calculates total carbon emissions in metric tons based on, but not limited to, mileage and load count information at an aggregate and lane-level detail. SONAR SCI also has rate benchmarking and network analysis capabilities, making it a one-stop shop for measuring trucking network effectiveness.

Related Posts

FreightWaves adds fuel data to SONAR SCI

How a CPG Shipper Stayed Out of the Spot Market and Achieved a 20x ROI

Using SCI to evaluate the efficacy of transportation spend

Search

Search

What's the SONAR ROI?

By increasing the number of loaded miles per day your drivers drive by 1% and your rate per mile by $0.03 you will make more per week #WithSONAR.

#WithSONAR you can save up to per week through better bid negotiations and more effective management of your routing guide.

#WithSonar you can add 1 more load per person each day and increase $5 margin per load, earning your company an extra per week.

Disclaimer: Every company’s circumstances are unique. Fixed and variable expenses, market conditions and operational factors vary. Unforeseen events may also affect results. Calculated potential results reflect the consensus expectation of FreightWaves’ experts. Actual results may vary.

Read Recent Posts

April 18, 2024

The Golden Handcuffs and the Key to Unlocking Success for Brokerages

April 16, 2024

Freight Market Data Sources

April 16, 2024

How Brokers Optimize Their Network With Market Dashboard Plus

White Papers
March 27, 2024

The State of Freight – March 2024

March 21, 2024

Take Demand Planning and Forecasting to the Next Level: An Introduction to Tender Data

February 6, 2024

Asleep at the Wheel: Shippers and the Freight Market Outlook for 2024