Monitoring freight market activity is an integral part of supply chains. Unfortunately, interpreting the data received is never straightforward. Erratic behavior in said data can lead to inaccuracies and confusion for carriers if the activity fails to conform to set standards. Even worse, data that isn’t monitored amounts to lost opportunities for improved efficiency. Carriers must havestate-of-the-art tools and technology to track and manage unusual and inconsistent activity in near-real-time. But what are these tools? And what are the key features they should have to make sure that all activities are managed efficiently? Luckily, the best insights are much easier to see than some realize and do not require waiting solely until invoicing and settlement have completed.
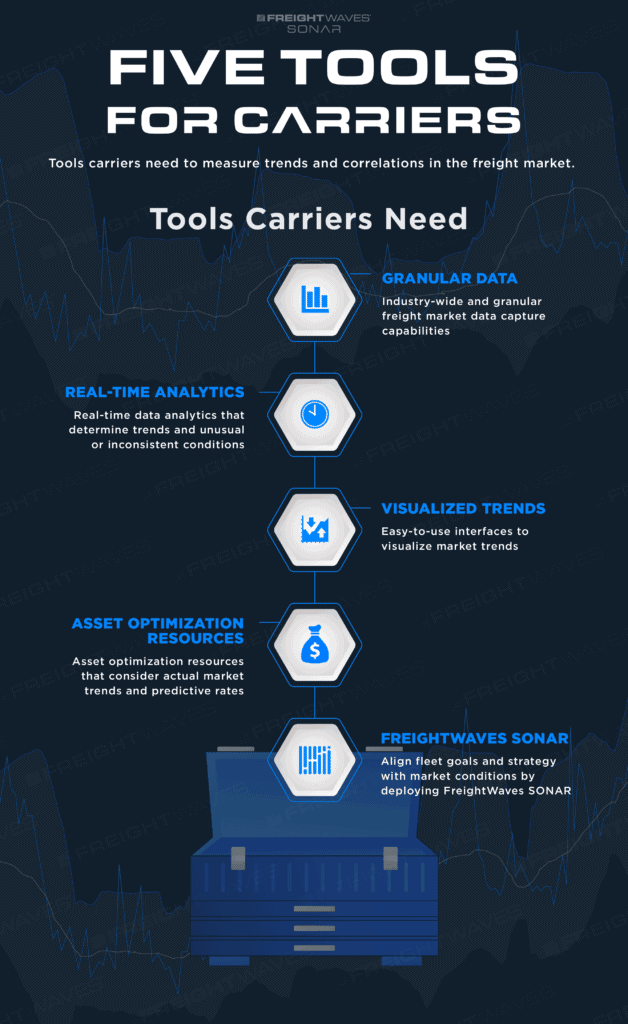
Industry-wide and granular freight market data capture capabilities
When capturing data from the freight market, carriers need to collect it from every available market and use this information to make improvements for their companies. As reported by Redwood Logistics, “As technology continues to improve our ability to gather data in near real-time, businesses are left with the task of figuring out how to leverage this data and apply it to intelligent business decisions. At times this can feel like an overwhelming task, with data coming in at faster rates and in higher volumes than ever before. However, with the proper supply chain analytic systems in place, you’ll be able to use this data to create value that sets your company on the path of continued success.” And part of that means tracking real-time truck location, gauging market trends and much more. Of course, that naturally implies an added ability to deploy the following connection opportunities to collect and apply data as well:
The Internet of Things (IoT) tracks the location of a carrier, projects weather conditions, and traffic conditions in real-time.
Although blockchain is more popular in cryptocurrency, this interface allows the viewer to visualize and track transactions as they happen between vendor and user.
AI & machine learning can easily parse through larger sets of data and gain insight from it on a granular level.
Real-time data analytics that determine trends and unusual or inconsistent conditions
The only way the freight market can ensure that activity is monitored is by utilizing real-time data analytics. Advanced insights are crucial in helping make more marketable and profitable decisions across all transits in a company. Data can be very confusing and constantly changing, especially in the supply chain industry, so the information coming in must be up to date. Even though the data received may be current, interpreting it can be challenging at best. That’s where analytics sort through the noise to find the most meaningful and actionable trends affecting either shippers or carrier asset management.
The tools used in the freight market must not only be up to date but should project the data in a simple yet cohesive manner. Other industries use interfaces that allow them to visualize the data to easily pinpoint market trends. There’s no reason why the supply chain industry shouldn’t leverage them for their benefit too. Plus, visualization functions, such as 3D maps, overlays, charts, heat maps and tree maps can go a long way in turning raw data points, including tickers, into actionable insights.
At the end of the day, these tools showcase trends and inconsistencies in the freight market and in-turn use the data to help drive stronger ROI for supply chain companies.
Asset optimization resources that consider actual market trends and predictive rates
Trends in the freight market continue to change, especially when it’s least expected. So it’s imperative to optimize the resources to have a more accurate projection of the ever-changing trends and freight rates that are happening in real-time. Of course, companies must come up with a standardized process to capture and analyze the data provided. And they must also put it to work. But that’s not the entirety of the picture. It goes further into the reality of knowing whether the steps taken afforded meaningful advantages, such as finding capacity. That’s where other resources, such as a measure of predictive rate accuracy, such as SONAR’s Scientific tickers can help.
Align fleet goals and strategy with market conditions by deploying FreightWaves SONAR
Real-time freight market data is a very delicate resource that can be confusing. But using advanced market intelligence tools will make it easier to visualize market trends. To learn more, request a FreightWaves SONAR demo by clicking the button below now.