No summer siesta for airfreight
Traditionally, air cargo spot rates tend to decline or remain flat at best during H1, ...

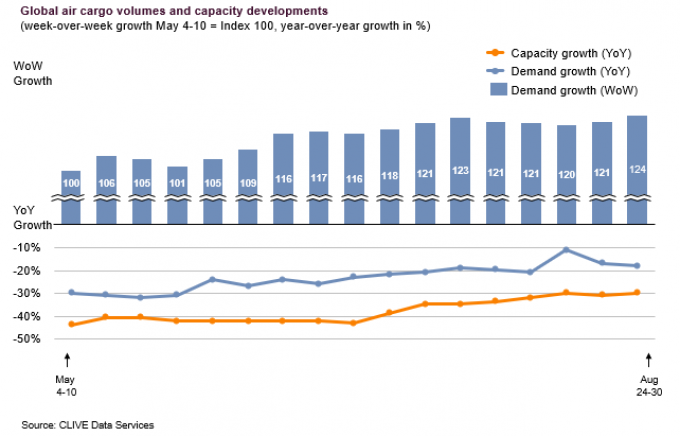
August may traditionally be the ‘silly season’ – or slack season, in freight terms – but air cargo load factors are some 8% higher than a year ago, while volumes are down just 17% from 2019.
In the last week of August, volumes were just 4% lower than a year earlier on China to Europe lanes, showing that fears of a lack volumes after the PPE peak have not materialised.
The industry has come a long way since April, when volumes were 41% down, year on year.

The data is “not great, but by no means a disaster,” according to Clive Data Services, which recorded a two-percentage point fall in dynamic loadfactors from July, when they were at 70%.
“The capacity crunch is still there, but is becoming slightly less and, as a result, loadfactors and yields are going down, closer to pre-Covid levels, even though they are still elevated,” said Clive managing director Niall van de Wouw.
“Airline cargo departments have never been in control of their own destiny, but they are in control of the present and short-term, in deciding where to place their cargo capacity.
“Whereas cargo has often been regarded as the ‘freeloader’ of the airline industry, because it has always been a by-product of far greater passenger revenues, right now it is passengers who are the ‘freeloaders’, because cargo is the main source of revenue for many airlines and helping to get passenger flights back into the air.”
But until significant passenger numbers return, he added, “air cargo will continue to have its day in the sun, and combination carriers will have to hope this can sustain their slimmed-down operations until passenger confidence and bookings return”.
On the Atlantic, additional capacity saw the westbound loadfactor fall from 88% to 82% at the end of August, while eastbound fell from 72% to 65% – but loadfactors on the routes remain some 20 percentage points higher than the same period in 2019.

Pricing also slipped slightly from July. While yields out of China remain high, with China to Europe some 25% higher than August 2019 and capacity 19% lower, pricing from China to Europe fell 2.5% in August from July. Yields on the transpacific are some 35% higher year on year, according to the TAC Index, but pricing fell about 5% from July.

Pricing is reacting more quickly to market conditions than it has before, notes Robert Frei, business development director at TAC Index.

Pricing for last week of August 2020
“This obviously has to do with most carriers and forwarders breaking their contracts during the crisis, and the fact that procurement is now done on a shorter-term basis.
“With shippers also finding forecasting even more difficult during the present conditions, this situation may continue for some time. All parties are currently looking at new ways of negotiating contracts, possibly using index-linked agreements or new risk management tools outside the physical market.”
Freight Investor Services, meanwhile, warned that capacity was booked up for the fourth quarter, which, it said, would be “concerning” for those without booked capacity.
FIS, which promotes air freight forward agreements, added: “The vast majority of hedging interest has been either to lock-in Q4 prices against any nasty surprises, or, more significantly, to establish a categorical baseline air freight price for 2021 and even 2022.”

FIS: forward pricing curve


Comment on this article