Remove Analysis Remove Capacity Remove Data Remove Examples
article thumbnail

How We Use Data to Better Plan for Produce Season

FreightWaves SONAR

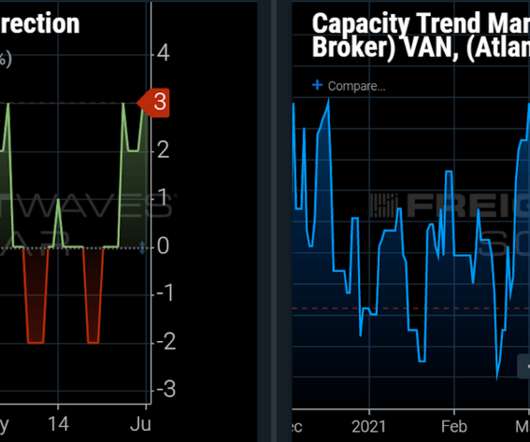
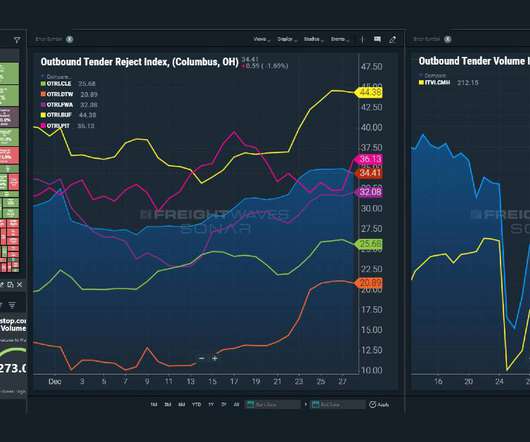
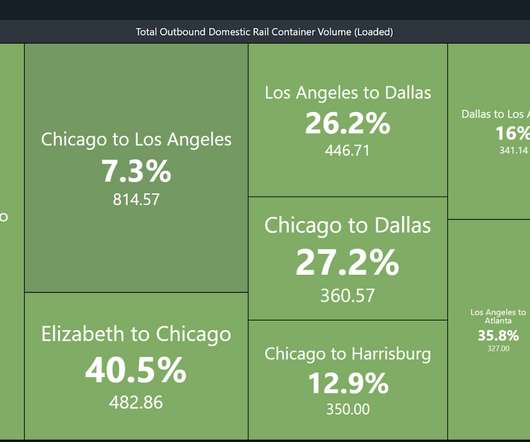
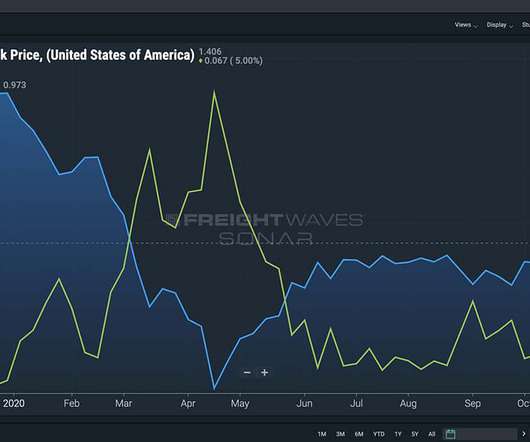
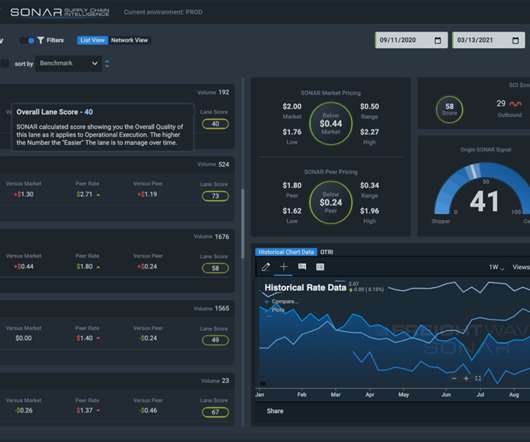
This pulls the capacity from not only those direct markets, but surrounding areas as well. This is where being able to monitor tender data at the market level can become your secret superpower. Take, for example, the market of Twin Falls, Idaho in comparison to Lakeland, Florida.

article thumbnail

June 4, 2024 Update

Freightos

More Resources Home June 4, 2024 Update The Freightos Weekly Update helps you stay on top of the latest developments in international freight by giving you the rundown on the latest economic data, ocean and air demand trends, rate data – and anything else impacting the market. Europe – N. America weekly prices fell 2% to $1.7/kg.

Insiders

Sign Up for our Newsletter

This site is protected by reCAPTCHA and the Google Privacy Policy and Terms of Service apply.

article thumbnail

Global Logistics Market Analysis: 2022 Summer Edition

MTS Logistics

We experience such diverse supply chain disruptions that tracking the data on U.S. Last year was marked with capacity issues and high prices, but today, freight prices have decreased, while capacity has increased. The post Global Logistics Market Analysis: 2022 Summer Edition appeared first on More Than Shipping.

article thumbnail

Why near-real-time electronic freight tender trucking data is more reliable than waiting on submitted data

FreightWaves SONAR

Data for data’s sake lacks value, especially in the view of the supply chain. And across the market, submitted data becomes rapidly outdated. And in some industries, outdated data can have disastrous consequences. For instance, take the value added by more accurate data in the health industry.

Data 98
article thumbnail

FreightWaves SONAR releases Capacity Trend Indices

FreightWaves SONAR

FreightWaves SONAR is releasing new indices – Capacity Trend Market Scores and Capacity Trend Market Direction – to help shippers, carriers and brokers prioritize specific routes daily. Capacity Trend Market Scores Capacity Trend Market Scores are divided into two perspectives – shipper/broker and carrier.

Trends 52
article thumbnail

Why is freight data a powerful weapon in the era of COVID-19?

FreightWaves SONAR

The COVID-19 crisis unveiled major issues within global supply chains and, as we have seen with SONAR freight data, volatility in the market. For those that make the right applications of freight data, the massive problems created by the pandemic could have been more easily mitigated.

Data 52
article thumbnail

SONAR Indices & Insights: Plan and Measure Refrigerated Shipping Capacity & Rates

FreightWaves SONAR

This week, learn how freight market participants, especially those freight parties who are executing refrigerated shipping moves, rely on SONAR indices that show reefer freight data and activity. The reasons for a carrier to reject the load tender are: 1) lack of trucking capacity; and 2) the rate is too low. RHAUL.ATL = 50.